Sildenafil
Product Images NDC 76519-1218

8 FDA label images from H.j. Harkins Company, Inc. · Packaging, Regulatory Labels, and Product Appearance

Product Visual Gallery

This gallery contains 8 technical images submitted to the FDA as part of the official labeling for Sildenafil (NDC 76519-1218). Unlike standard consumer photos, these assets often include clinical data figures, molecular chemical structures, and official manufacturer packaging layouts.

As provided by H.j. Harkins Company, Inc., these visuals offer a comprehensive scientific overview of the product's physical and chemical identity, aiding pharmacists and researchers in product verification and study.

FDA Label Image

1216 Label (76519 1216 Ppac Label)
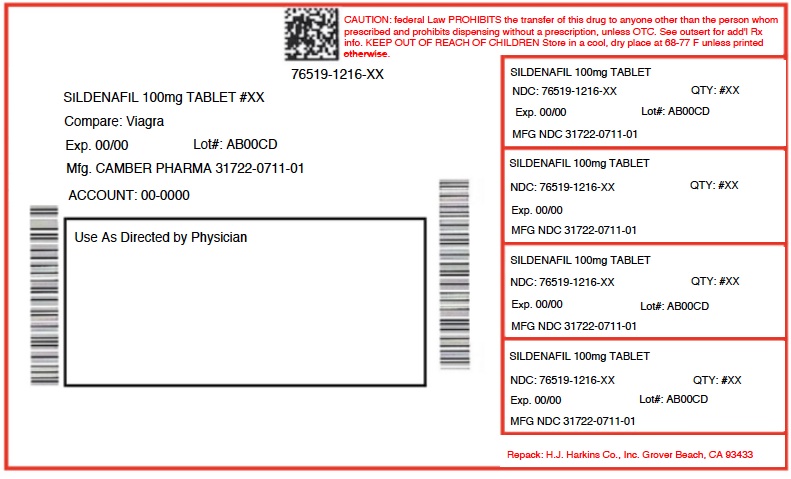
1216 Label (76519 1216 Ppac Label)
SILDENAFIL 100 mg tablet packaging label from H.J. Harkins Company, Inc. The label includes the proprietary name, strength, and dosage form, with multiple pill bottle safety seals or tear strips indicating quantity, lot number, and expiration date placeholders. It also carries a federal law caution and storage instructions.*
FDA Label Image

1218 Label (76519 1218 Ppac Label)

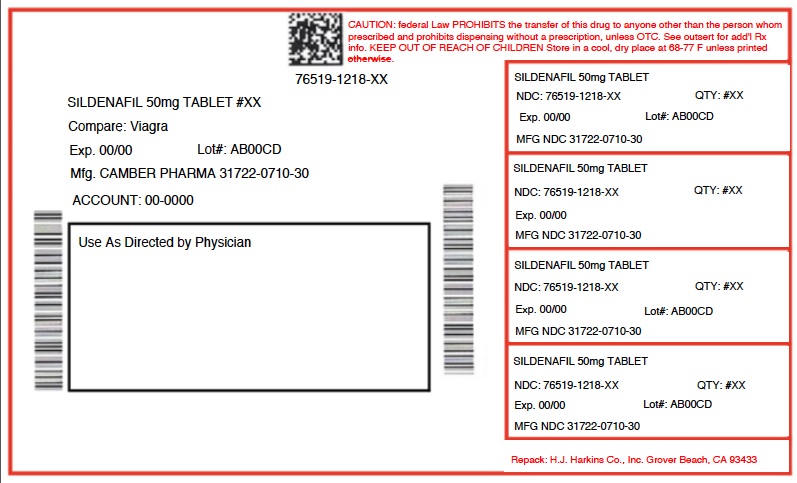
1218 Label (76519 1218 Ppac Label)
Packaging label for SILDENAFIL 50mg tablets from H.J. Harkins Company, Inc. The label includes multiple instances of the drug name with strength and the MFG NDC 31722-0710-30. It shows lot number AB00CD, expiration 00/00, and quantity indicated as #XX. The label also states "Use As Directed by Physician" and highlights federal law caution about drug dispensing.*
FDA Label Image

Image 1 (Image 1)

Image 1 (Image 1)
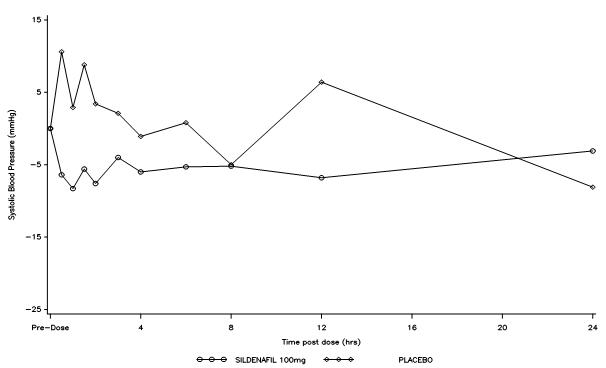
A line graph depicting the change in systolic blood pressure (mmHg) over 24 hours post-dose for Sildenafil 100mg and placebo groups. The x-axis represents time in hours after dosing, and the y-axis shows systolic blood pressure changes. Two lines compare the effects of Sildenafil 100mg and placebo on blood pressure.*
FDA Label Image

Image 2 (Image 2)

Image 2 (Image 2)
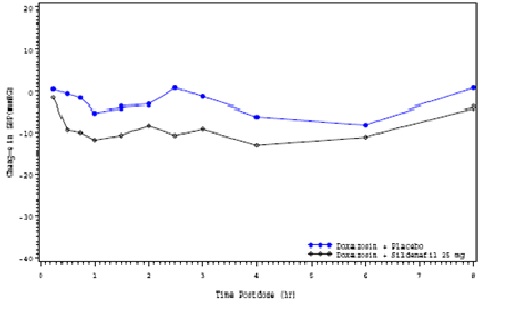
A line graph depicting changes in blood pressure (mmHg) over time (hours) for two treatment groups: Placebo and Cilnidipine 10 mg. The x-axis represents time postdose in hours, and the y-axis shows changes in blood pressure in mmHg. Two data lines with markers illustrate the trend for each treatment over an 8-hour period.*
FDA Label Image

Image 3 (Image 3)

Image 3 (Image 3)
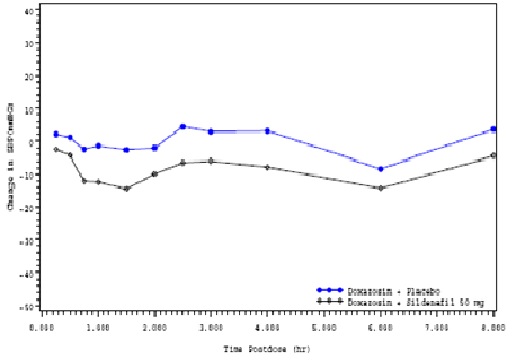
A line graph depicting the change in a specific measure over time in hours postdose. It compares Doxazosin plasma levels (blue line) with Doxazosin plus Sildenafil 50 mg (gray line), showing their respective fluctuations over an 8-hour period.*
FDA Label Image

Image 4 (Image 4)

Image 4 (Image 4)
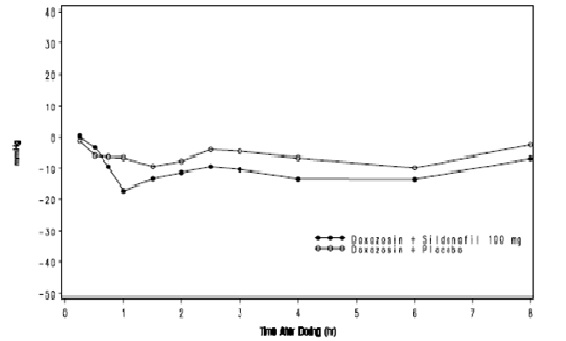
A line graph showing the effect on mean arterial pressure over time (hours) after dosing, comparing Doxazosin with Sildenafil 100 mg versus Doxazosin with Placebo. The x-axis represents time after dosing (0 to 8 hours), and the y-axis shows mean arterial pressure with values ranging from -50 to 40.*
FDA Label Image

Image 5 (Image 5)

Image 5 (Image 5)
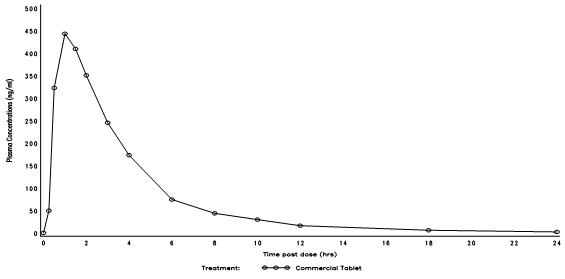
A pharmacokinetic curve showing plasma concentration (ng/mL) of Sildenafil over time (hours) after a single dose. The graph plots concentration against time up to 24 hours, depicting data for a commercial tablet formulation from H.J. Harkins Company, Inc.*
FDA Label Image

Image (Image)

Image (Image)
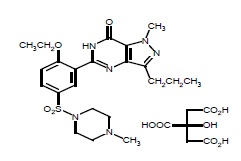
Chemical structure diagram of Sildenafil, showing its molecular configuration with labeled functional groups including a sulfonamide, piperazine ring, and methyl substituents.*

* About these descriptions: Image descriptions on this page are generated by automated AI analysis of the product label images from the manufacturer's FDA label submission (SPL). They are provided for reference only and may contain errors or omissions. Always rely on the printed label itself and the official FDA labeling, and consult a pharmacist or healthcare professional with any questions about this product.