Estradiol And Norethindrone Acetate Tablet
Product Images NDC 79929-012

View Photos of Packaging, Regulatory Labels, and Product Appearance

Product Visual Gallery

This gallery contains 11 technical images submitted to the FDA as part of the official labeling for Estradiol And Norethindrone Acetate (NDC 79929-012). Unlike standard consumer photos, these assets often include clinical data figures, molecular chemical structures, and official manufacturer packaging layouts.

As provided by Naari Pte. Limited, these visuals offer a comprehensive scientific overview of the product's physical and chemical identity, aiding pharmacists and researchers in product verification and study.

FDA Label Image

Image Description (210233 Outer)

Image Description (210233 Outer)
Packaging label for Estradiol and Norethindrone Acetate Tablets, USP, 1 mg/0.5 mg oral tablets. The label indicates the product contains 3 blister cards each with 28 tablets. It is manufactured for Naari Pte. Limited in Singapore. The label includes storage instructions and a note that the package is not child resistant.*
FDA Label Image

Image Description (Draft Labeling Text)

Image Description (Draft Labeling Text)
Pack label for Estradiol and Norethindrone Acetate Tablets, USP, 1 mg/0.5 mg oral tablets by Naari Pte. Limited. The label features a 28-tablet calendar with circles for each day of the week across 4 weeks. Instructions show a hand peeling a strip labeled with days (SUN to SAT) to place above the calendar. The label indicates Rx only and space to apply a correct day label.*
FDA Label Image

Image Description (Estradiol)

Image Description (Estradiol)
Chemical structure diagram of estradiol, the active ingredient in estradiol and norethindrone acetate tablets.*
FDA Label Image

Image Description (Figure 1a)

Image Description (Figure 1a)
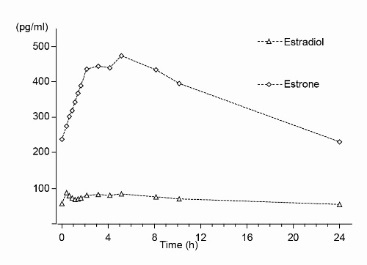
A line graph depicting plasma concentration over time (hours) for Estradiol and Estrone. The y-axis shows concentration in pg/ml, ranging from 0 to 600, and the x-axis shows time in hours from 0 to 24. Estrone shows a higher concentration peak around 4 hours compared to Estradiol, which remains relatively stable.*
FDA Label Image

Image Description (Figure 1b)

Image Description (Figure 1b)
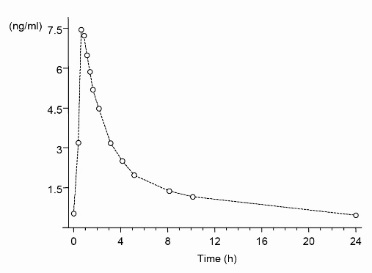
A pharmacokinetic line graph showing plasma concentration (ng/ml) over time (hours) following drug administration. The curve peaks sharply near the beginning, then gradually declines over 24 hours, depicting the drug's concentration decrease in the bloodstream over time.*
FDA Label Image

Image Description (Figure 2)

Image Description (Figure 2)
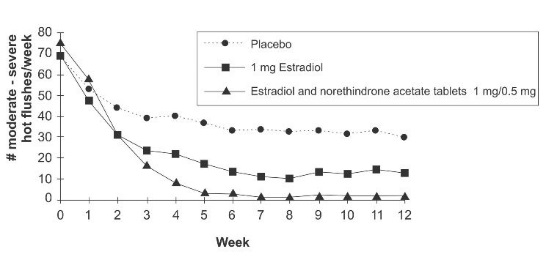
A line graph depicting the number of moderate to severe hot flushes per week over 12 weeks across three treatments: placebo, 1 mg estradiol tablets, and estradiol and norethindrone acetate tablets (1 mg/0.5 mg). The graph shows a decrease in hot flushes over time, with the combination tablets reducing symptoms more rapidly and to a lower level than estradiol alone or placebo.*
FDA Label Image

Image Description (Figure 3)

Image Description (Figure 3)
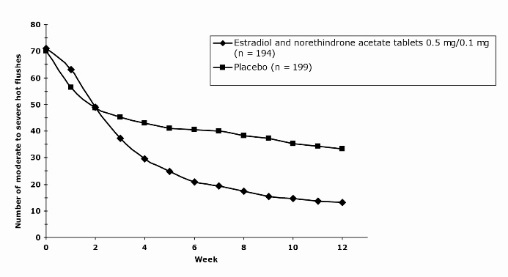
A line graph comparing the number of moderate to severe hot flushes over 12 weeks between two groups: one taking estradiol and norethindrone acetate tablets 0.5 mg/0.1 mg (n=194) and a placebo group (n=199). The graph shows a decrease in hot flushes over time in the treatment group compared to placebo.*
FDA Label Image

Image Description (Figure 4)

Image Description (Figure 4)
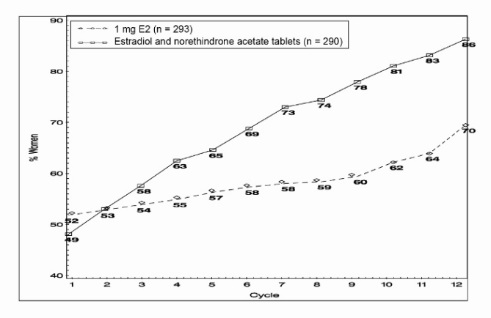
A line graph comparing two groups over 12 cycles, showing percentage values on the Y-axis and cycle number on the X-axis. The first group represents 1 mg estradiol (E2), displayed with a dashed line, and the second group represents estradiol and norethindrone acetate tablets, shown with a solid line. The graph illustrates changes in percentage across cycles for each group.*
FDA Label Image

Image Description (Figure 5)

Image Description (Figure 5)
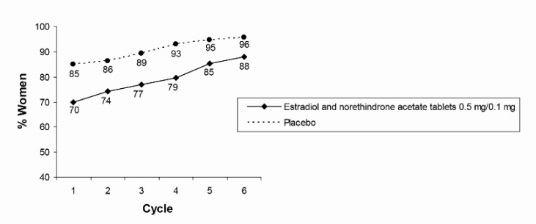
Line graph comparing the percentage of women over six cycles taking estradiol and norethindrone acetate tablets 0.5 mg/0.1 mg versus placebo. The active drug group shows a higher percentage that increases from 85% to 96%, while the placebo group rises from 70% to 88%.*
FDA Label Image

Image Description (Figure 6)

Image Description (Figure 6)
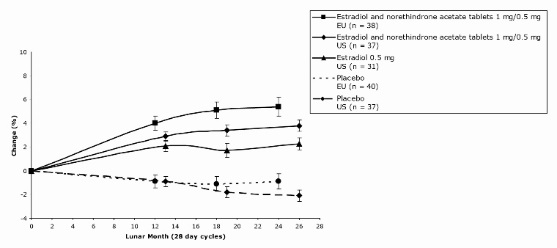
A line graph showing percentage change over lunar months (28-day cycles) for different groups including estradiol and norethindrone acetate tablets 1 mg/0.5 mg (EU and US), estradiol 0.5 mg (US), and placebo (EU and US). The graph includes error bars and a legend identifying each group.*
FDA Label Image

Image Description (Nor Acetate)

Image Description (Nor Acetate)
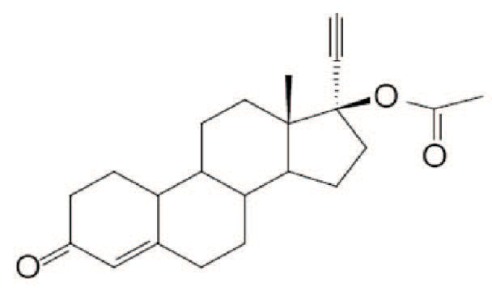
Chemical structure of estradiol acetate, an active ingredient in estradiol and norethindrone acetate tablets by Naari Pte. Limited.*

* About these descriptions: Image descriptions on this page are generated by automated AI analysis of the product label images from the manufacturer's FDA label submission (SPL). They are provided for reference only and may contain errors or omissions. Always rely on the printed label itself and the official FDA labeling, and consult a pharmacist or healthcare professional with any questions about this product.