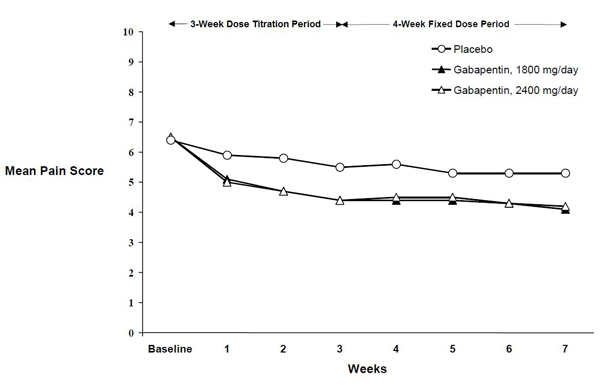
Fig. 1 (Fig 1)
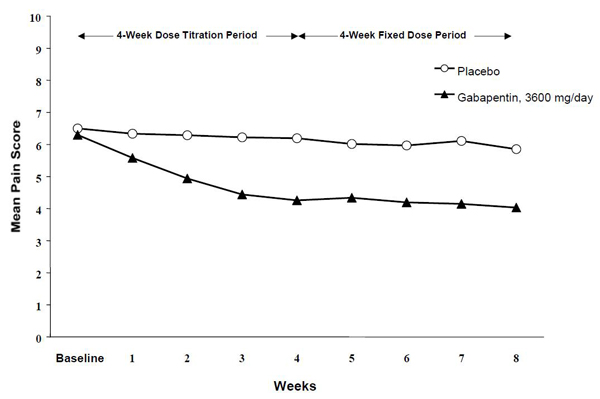
This appears to be a table or chart showing the mean pain score for a study involving a dose titration period followed by a fixed dose period, comparing a placebo to a dose of 3600 mg/day of gabapentin. The numbers are not clear without proper context, but it seems to show pain scores at baseline and at various weeks during the study.*