Gabapentin Capsule
Product Images NDC 80425-0033

View Photos of Packaging, Regulatory Labels, and Product Appearance

Product Visual Gallery

This gallery contains 9 technical images submitted to the FDA as part of the official labeling for Gabapentin (NDC 80425-0033). Unlike standard consumer photos, these assets often include clinical data figures, molecular chemical structures, and official manufacturer packaging layouts.

As provided by Advanced Rx Of Tennessee, Llc, these visuals offer a comprehensive scientific overview of the product's physical and chemical identity, aiding pharmacists and researchers in product verification and study.

FDA Label Image

Fig 1

Fig 1
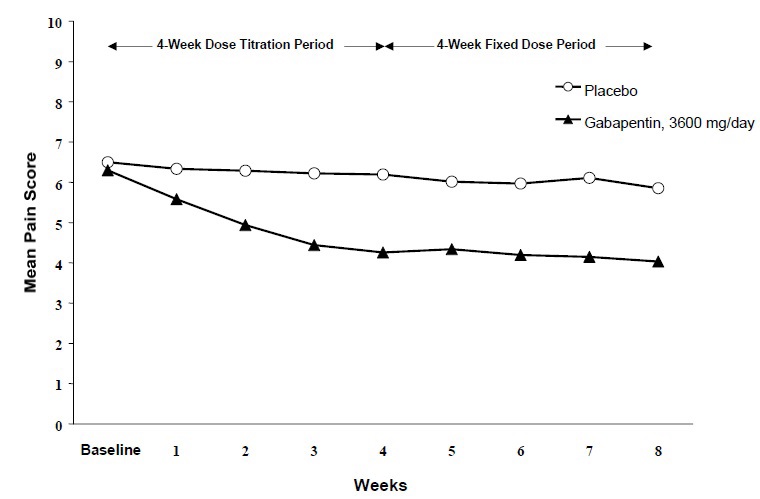
This appears to be a chart or graph displaying the mean pain score for a study or trial over a 4-week dose titration period, followed by a 4-week fixed dose period. The study compares a placebo group to a group taking 3600 mg/day of Gabapentin. The text provides no other information about the study or the pain being evaluated.*
FDA Label Image

Fig 2

Fig 2
This appears to be a chart showing the Mean Pain Score for different treatments over a course of several weeks. The chart includes placebo and different doses of a medication called Gabapentin. The first column shows the baseline score before treatment started.*
FDA Label Image

Fig 3

Fig 3
The text provides a table with percentage values for "Proportion of Responders" in "Controlled PHN Studies". There are different percentages for different treatments mentioned such as GBP 3600, PBO, GEBP 1800, GBP 2400. The table also includes information about statistical analysis with the #p<001 and mentions that the data is from endpoint studies. Therefore, this text depicts results of a study comparing different treatments for PHN but no further information is available.*
FDA Label Image

Fig 4

FDA Label Image

Gabapentin 300mg Cap Qty 30 Ndc 80425 0033

FDA Label Image

Gabapentin 300mg Cap Qty 40 Ndc 80425 0033

FDA Label Image

Gabapentin 300mg Cap Qty 60 Ndc 80425 0033

FDA Label Image

Gabapentin 300mg Cap Qty 90 Ndc 80425 0033

FDA Label Image

Structure

* These product label images have been analyzed using experimental machine learning. Please verify findings with the primary label text.