Figure 1
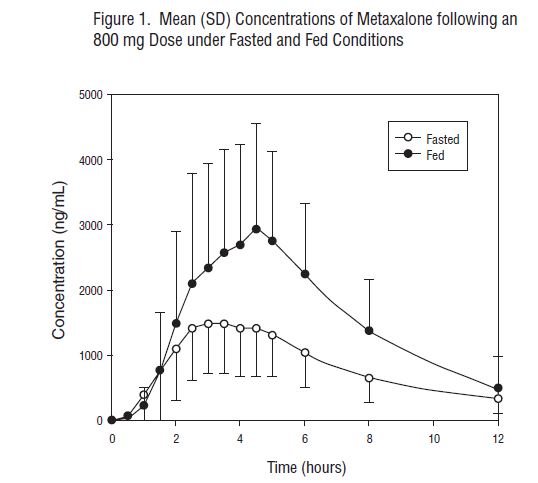
This is a graph that shows the mean concentrations of Metaxalone in ng/mL following a dose of 800 mg under fasted and fed conditions, measured at different time points. The x-axis represents time in hours, and the y-axis represents the concentration in ng/mL. The blue line represents the concentration under fed conditions, while the orange line represents the concentration under fasted conditions. There are no other available information to describe the graph or the context in which it was produced.*