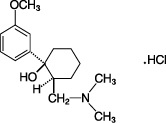
Fig 1

This is a graph representing Tramadol concentration (ng/mL) over time (h). Two different forms of Tramadol administration are compared: Tramadol Hydrochloride Extended-Release Tablets, 200 mg q.d, and Tramadol Hydrochloride Tablets, 50 mg g6h. The graph shows decreasing Tramadol concentration over time.*