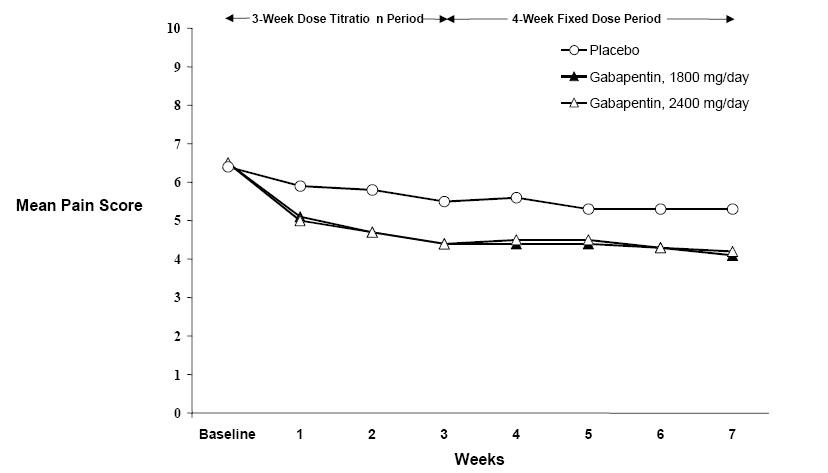
Fig 1
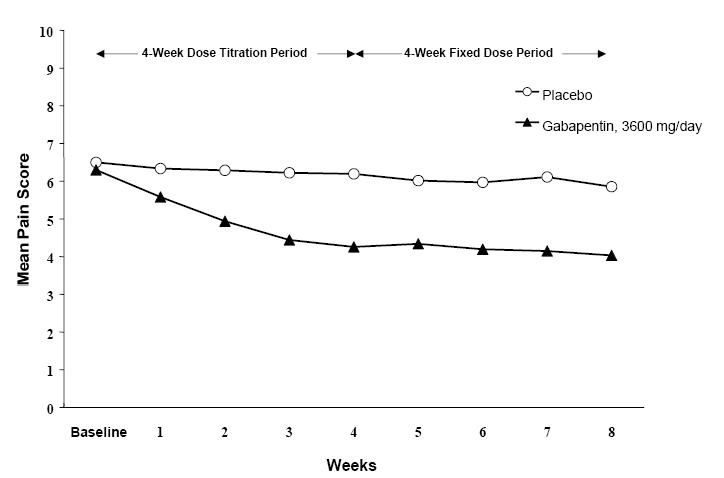
This appears to be a graph depicting the mean pain score over a period of several weeks, with a 4-week dose titration period followed by a 4-week fixed dose period. The graph compares the effects of a placebo versus a dose of gabapentin at 3600 mg/day. However, without additional context or labels, it is difficult to interpret the specific details and purpose of the graph.*