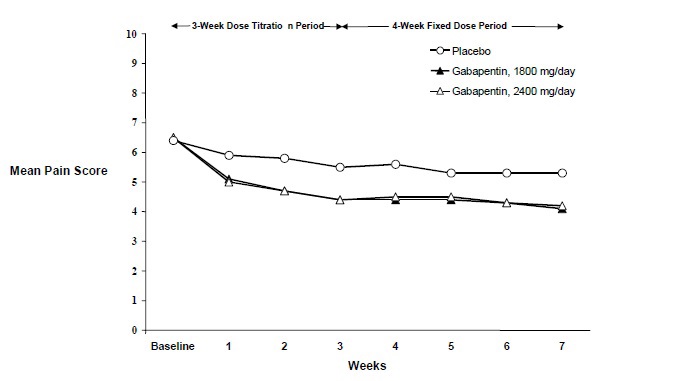
Product Images Gabapentin

View Photos of Packaging, Labels & Appearance

Product Label Images

The following 7 images provide visual information about the product associated with Gabapentin NDC 80425-0163 by Advanced Rx Pharmacy Of Tennessee, Llc, such as packaging, labeling, and the appearance of the drug itself. This resource could be helpful for medical professionals, pharmacists, and patients seeking to verify medication information and ensure they have the correct product.

Fig 1

Fig 1

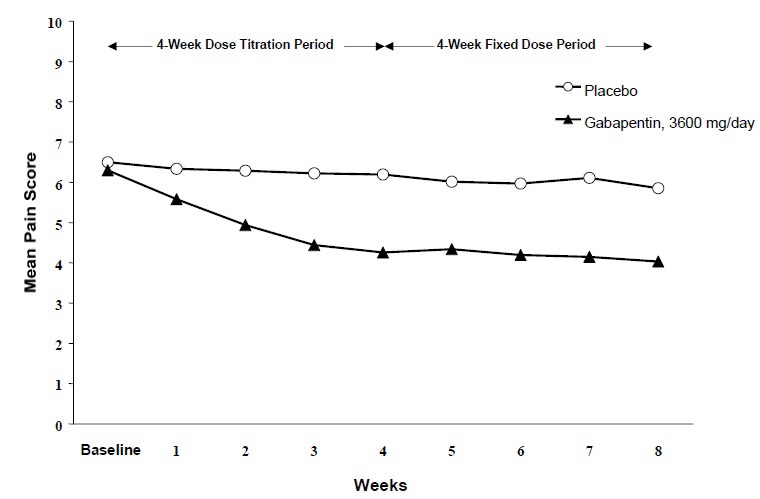
This appears to be a chart or table showing the mean pain score during a 4-week dose titration period and a subsequent 4-week fixed dose period. The two groups being compared are a placebo group and a group taking gabapentin at a dose of 3600 mg/day. The baseline is also noted.*

Fig 2

Fig 2

This appears to be a chart or graph related to a study on different dosages of Gabapentin for pain management. The chart shows the mean pain score at baseline and over several weeks for four groups: a placebo group, a group taking 1800mg/day of Gabapentin, a group taking 2400mg/day of Gabapentin, and a group undergoing a dose titration period. Beyond that, the text provides no additional information.*

Fig 3

Fig 3

The text represents a chart or table showing the proportion of responders in controlled PHN studies at endpoint. The chart shows percentage scores ranging from 10% to 100% in increments of 10%. The table provides additional data for each study, including study number, percentage of responders (ranging from 12% to 29%), and the names of different treatments (GBP 3600, PBO, GEBP 1800, and GBP 2400). There is a reference to "#p<00l < 0,001," indicating statistical significance, but it is not clear what this refers to without further context.*

Fig 4

Fig 4

Formula

Formula

Gabapentin 400mg Tab Qty 90 NDC 80425 0163

Gabapentin 400mg Tab Qty 90 NDC 80425 0163

The text could possibly be part of a medication label or prescription. It indicates that "Gabapentin 410mg" is available in capsule form and the quantity is "90" capsules. It also mentions a comparison, but the details are not clear. There is a reference number "90GAR4001221" at the end.*

Structure

Structure

* The product label images have been analyzed using a combination of traditional computing and machine learning techniques. It should be noted that the descriptions provided may not be entirely accurate as they are experimental in nature. Use the information in this page at your own discretion and risk.