Pregabalin Capsule
Product Images NDC 80425-0178

View Photos of Packaging, Regulatory Labels, and Product Appearance

Product Visual Gallery

This gallery contains 14 technical images submitted to the FDA as part of the official labeling for Pregabalin (NDC 80425-0178). Unlike standard consumer photos, these assets often include clinical data figures, molecular chemical structures, and official manufacturer packaging layouts.

As provided by Advanced Rx Pharmacy Of Tennessee, Llc, these visuals offer a comprehensive scientific overview of the product's physical and chemical identity, aiding pharmacists and researchers in product verification and study.

FDA Label Image

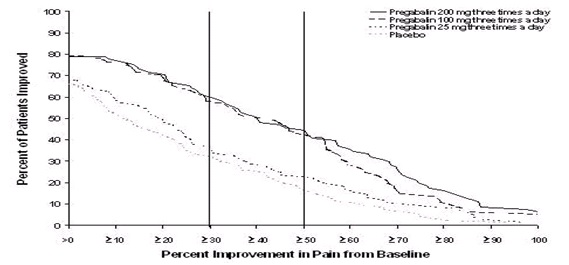
Fig 1 (Fig 1)

Fig 1 (Fig 1)
A line graph depicting the percent of patients improved on the y-axis and percent improvement in pain from baseline on the x-axis. It compares multiple treatment groups: Pregabalin 200 mg three times a day, 100 mg three times a day, 25 mg three times a day, and placebo, showing different degrees of pain improvement over the range.*
FDA Label Image

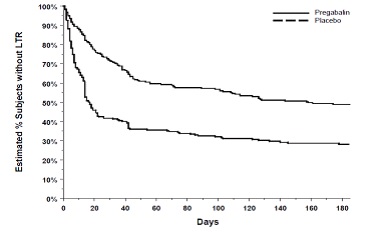
Fig 10 (Fig 10)

Fig 10 (Fig 10)
A line graph comparing the estimated percentage of subjects without LTR over days between Pregabalin and placebo groups. The y-axis represents the estimated percentage of subjects without LTR, and the x-axis represents days from 0 to 180, showing the trend over time for both groups.*
FDA Label Image

Fig 11 (Fig 11)

Fig 11 (Fig 11)
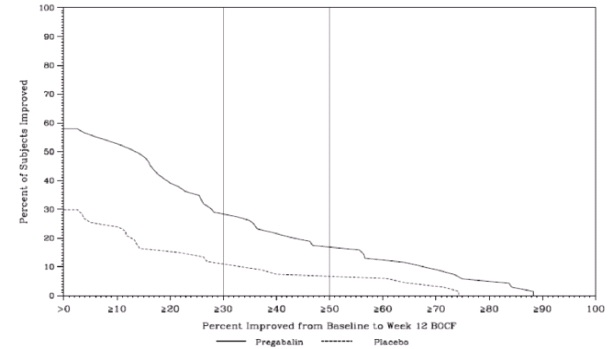
A line graph comparing the percent of subjects improved over time (percent improved from baseline to Week 12 BOCF) between Pregabalin and placebo groups. The x-axis shows percent improvement from >0 to 100, and the y-axis shows the percent of subjects improved from 0 to 90, with Pregabalin represented by a solid line and placebo by a dashed line.*
FDA Label Image

Fig 12 (Fig 12)

Fig 12 (Fig 12)
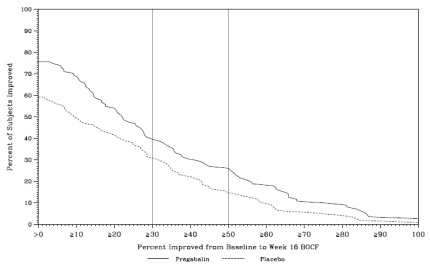
A line graph showing the percent of subjects improved over time from baseline to Week 16, comparing Pregabalin and placebo groups. The x-axis represents time, while the y-axis shows the percent of subjects showing improvement. The graph includes two lines representing Pregabalin and placebo responses.*
FDA Label Image

Fig 2 (Fig 2)

Fig 2 (Fig 2)
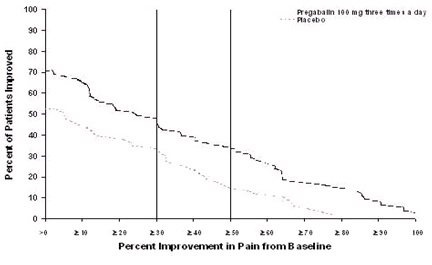
A line graph showing percent improvement in pain from baseline on the x-axis against the percent of patients improved on the y-axis. Two curves compare Pregabalin 100 mg three times a day and placebo, illustrating differences in pain improvement between the two groups.*
FDA Label Image

Fig 3 (Fig 3)

Fig 3 (Fig 3)
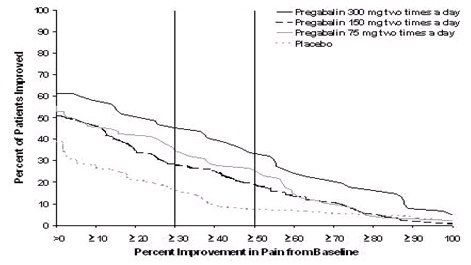
A line graph depicting percent improvement in pain from baseline on the x-axis against percent of patients improved on the y-axis. The graph compares multiple dosing regimens of Pregabalin (300 mg, 150 mg, 75 mg taken twice a day) and placebo, showing their relative effectiveness in pain improvement over different percentage improvement thresholds.*
FDA Label Image

Fig 4 (Fig 4)

Fig 4 (Fig 4)
A line graph comparing percent improvement in pain from baseline against percent of patients improved for Pregabalin 200 mg three times a day, Pregabalin 100 mg three times a day, and placebo groups. The graph shows the variation in patient response across different improvement percentages.*
FDA Label Image

Fig 5 (Fig 5)

Fig 5 (Fig 5)
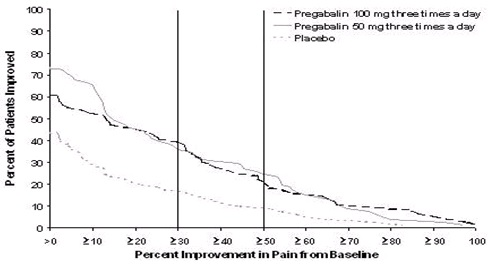
A line graph showing the percent improvement in pain from baseline on the x-axis and the percent of patients improved on the y-axis. It compares three groups: Pregabalin 100 mg three times a day, Pregabalin 50 mg three times a day, and a placebo, illustrating patient response rates across different improvement levels.*
FDA Label Image

Fig 6 (Fig 6)

Fig 6 (Fig 6)
A bar graph displaying responder rates as percentages in two studies labeled Study E1 and Study E3. The graph compares placebo and different dosages of a treatment, indicated in mg/day, illustrating variations in responder rates across groups. Statistically significant differences versus placebo are noted.*
FDA Label Image

Fig 7 (Fig 7)

Fig 7 (Fig 7)
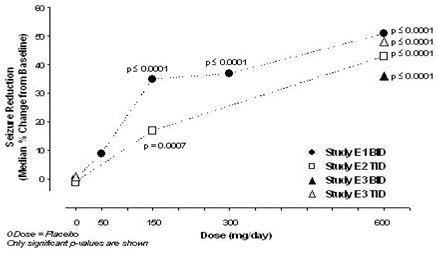
A line graph depicting seizure reduction (median % change from baseline) versus dose (mg/day) for Pregabalin at various daily doses comparing BID and TID regimens across multiple studies. The graph shows an increasing seizure reduction with higher doses, with statistical significance noted at various points.*
FDA Label Image

Fig 9 (Fig 9)

Fig 9 (Fig 9)
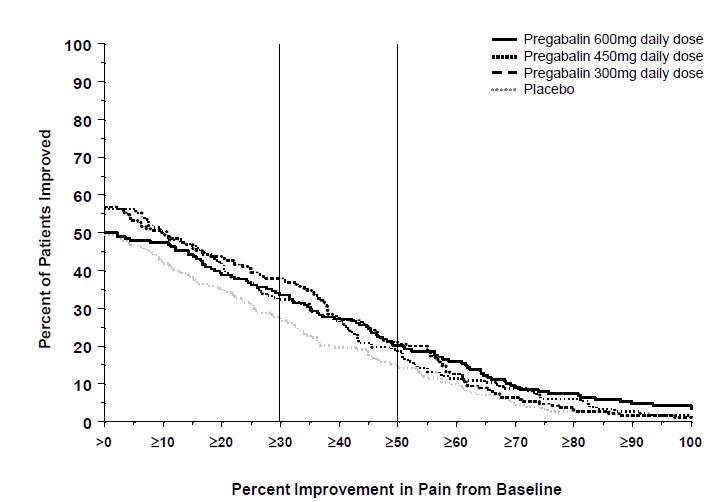
A line graph depicting the percent of patients improved versus percent improvement in pain from baseline. It compares four groups: Pregabalin 600 mg daily dose, Pregabalin 450 mg daily dose, Pregabalin 300 mg daily dose, and placebo, with separate lines for each. The graph shows the distribution of patient improvement across increasing percentages of pain reduction from baseline.*
FDA Label Image

Pregabalin #60 (Pregabalin 150mg Cap Qty 60 80425 0178)

Pregabalin #60 (Pregabalin 150mg Cap Qty 60 80425 0178)
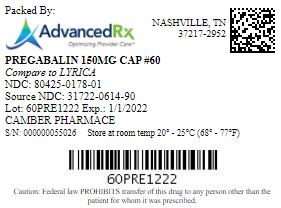
Label for Pregabalin 150 mg capsules, 60 count, labeled by Advanced Rx Pharmacy of Tennessee, LLC in Nashville, TN. The label includes a barcode, NDC 80425-0178-01, lot number, expiration date, and storage instructions (20°-25°C). It compares the product to Lyrica and notes it is a human prescription drug.*
FDA Label Image

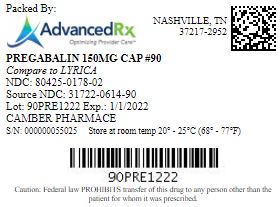
Pregabalin #90 (Pregabalin 150mg Cap Qty 90 80425 0178)

Pregabalin #90 (Pregabalin 150mg Cap Qty 90 80425 0178)
Label for Pregabalin 150 mg capsules, manufactured by Advanced Rx Pharmacy of Tennessee, LLC. The label includes product name, strength, NDC 80425-0178-02, source NDC 31722-0614-90, lot number 90PRE1222 Expiration date 1/1/2022, storage instructions, and a barcode with code 90PRE1222. The label also notes comparison to Lyrica and a federal caution on transfer restrictions.*
FDA Label Image

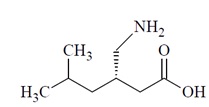
Structure (Structure)

Structure (Structure)
Chemical structure of pregabalin active ingredient, displayed as a molecular diagram with labeled groups including an amino group, carboxyl group, and side chains.*

* About these descriptions: Image descriptions on this page are generated by automated AI analysis of the product label images from the manufacturer's FDA label submission (SPL). They are provided for reference only and may contain errors or omissions. Always rely on the printed label itself and the official FDA labeling, and consult a pharmacist or healthcare professional with any questions about this product.