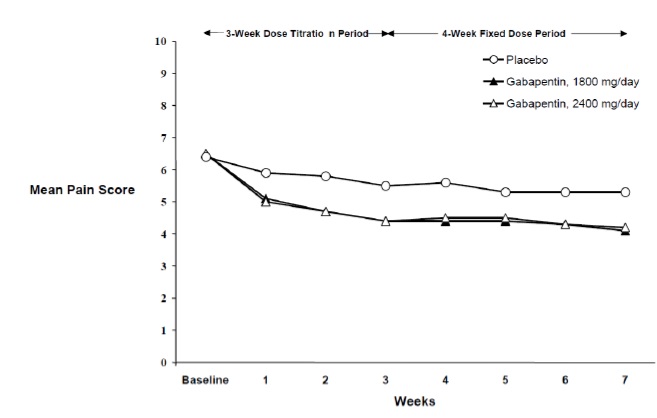
Fig 1 (Fig 1)
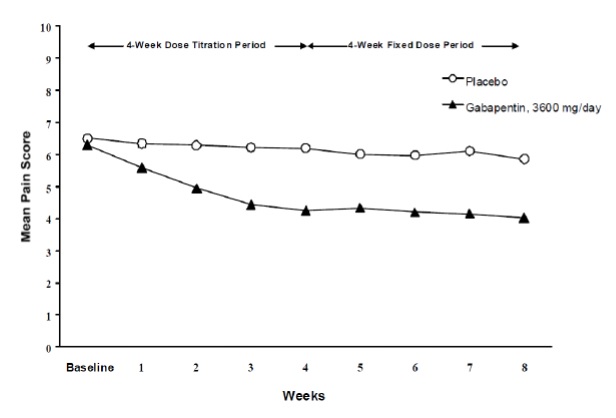
This appears to be a chart or data table that shows the mean pain score for a medication study. The study appears to have two treatment groups: a fixed dose group and a titration group. The medication being evaluated is called Parkod. The chart also includes a placebo group and a group taking gabapentin at a high dosage. There are scores listed for each treatment group at baseline and at different weeks throughout the study.*