Description (Description)
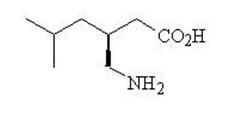
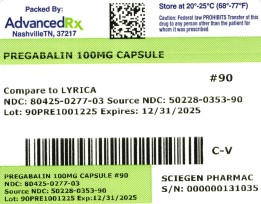
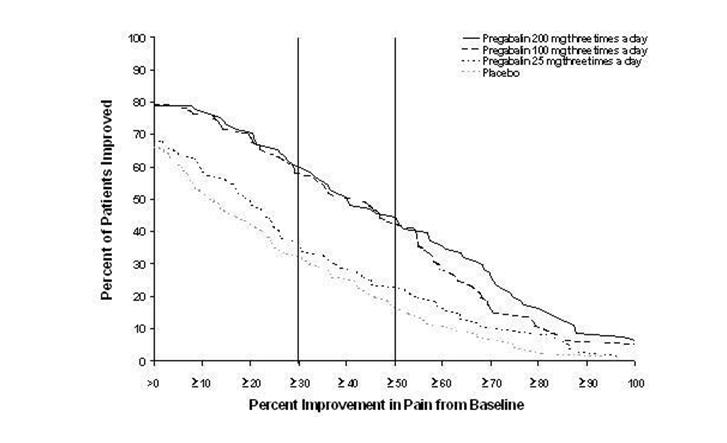
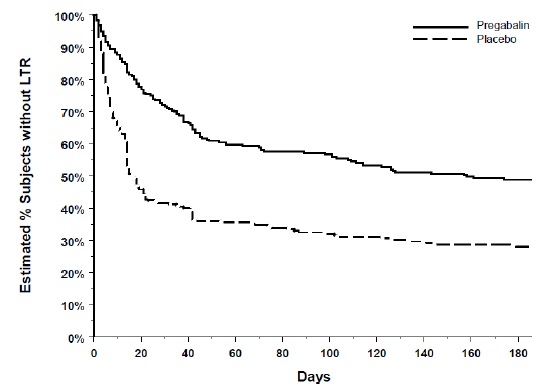
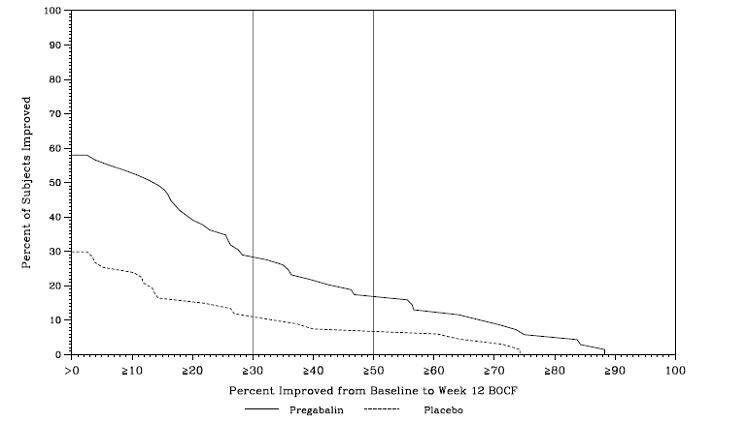
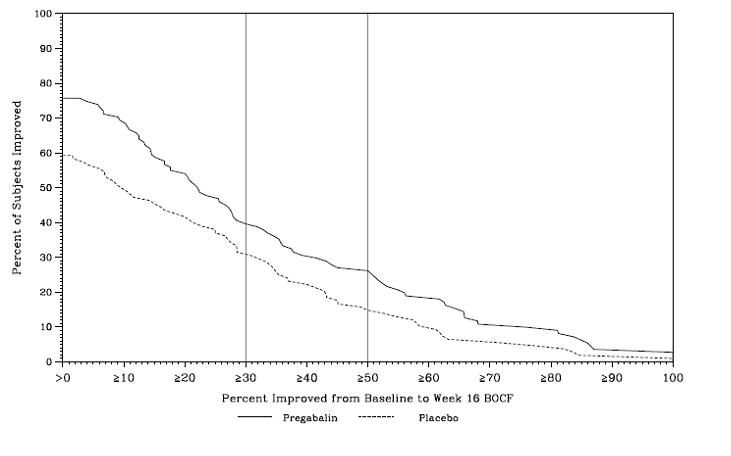
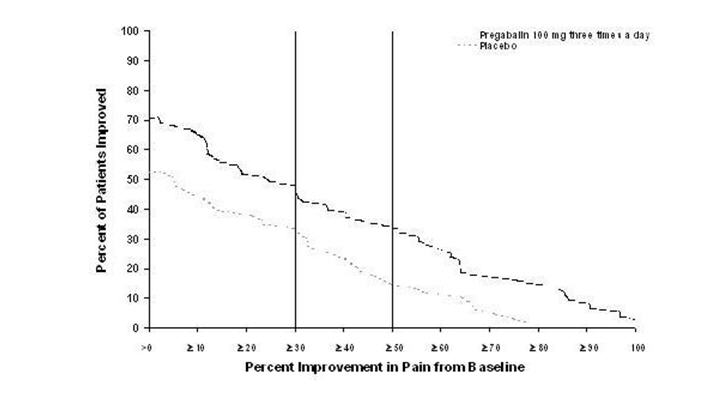
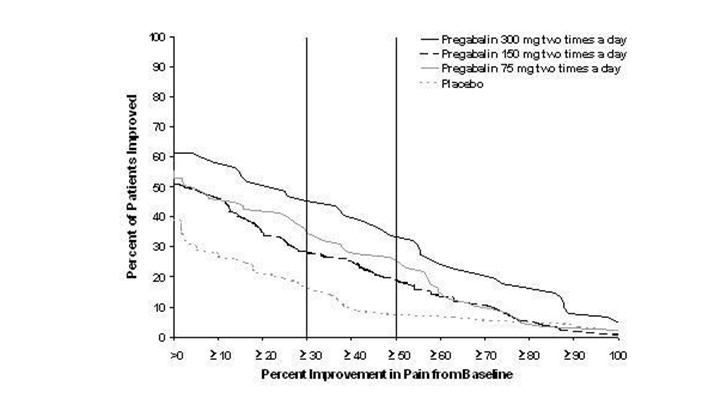
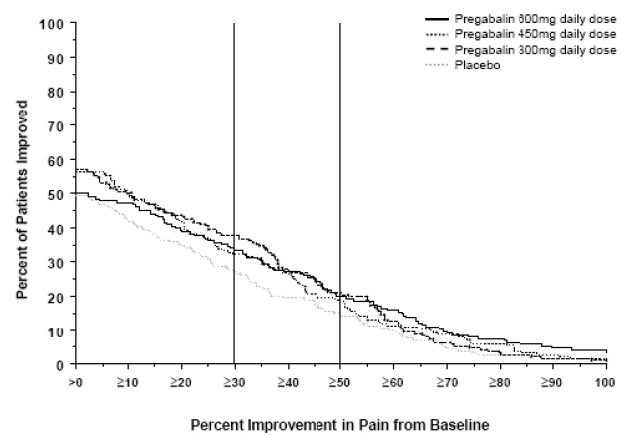
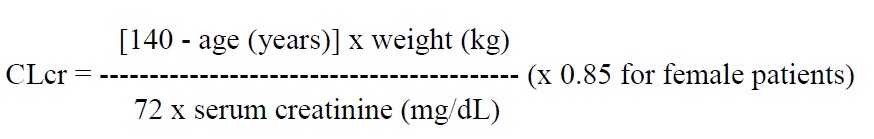
This gallery contains 14 technical images submitted to the FDA as part of the official labeling for Pregabalin (NDC 80425-0277). Unlike standard consumer photos, these assets often include clinical data figures, molecular chemical structures, and official manufacturer packaging layouts.
As provided by Advanced Rx Pharmacy Of Tennessee, Llc, these visuals offer a comprehensive scientific overview of the product's physical and chemical identity, aiding pharmacists and researchers in product verification and study.
* These product label images have been analyzed using experimental machine learning. Please verify findings with the primary label text.