Dutasteride Structural Formula (Avodart Spl Image 01)
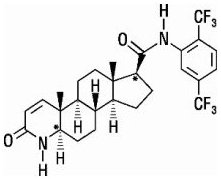
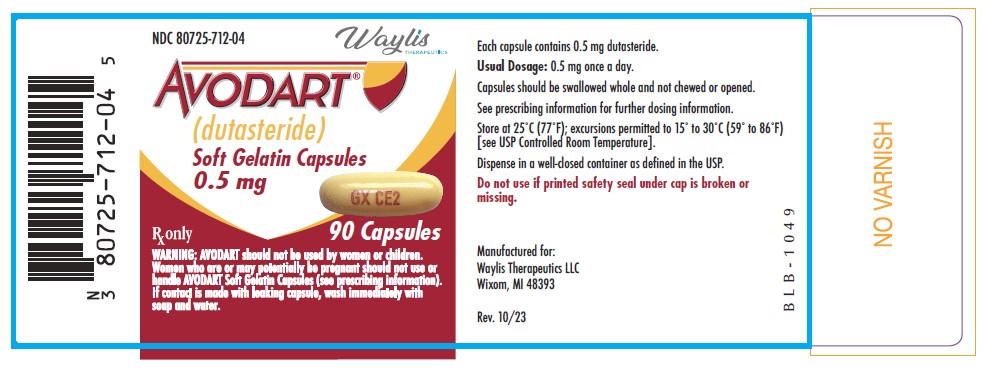
This gallery contains 9 technical images submitted to the FDA as part of the official labeling for Avodart (NDC 80725-712). Unlike standard consumer photos, these assets often include clinical data figures, molecular chemical structures, and official manufacturer packaging layouts.
As provided by Waylis Therapeutics Llc, these visuals offer a comprehensive scientific overview of the product's physical and chemical identity, aiding pharmacists and researchers in product verification and study.
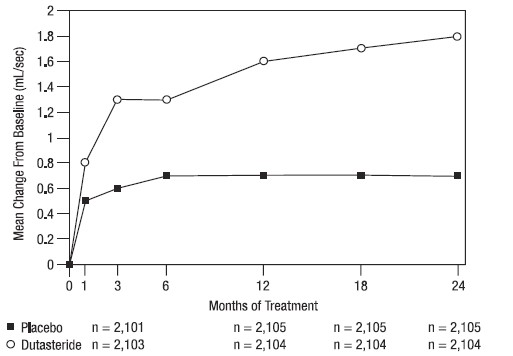
![Figure 7. Q-max Change Ffrom Baseline Over A 24-month Period (randomized, Double-blind, Parallel Group Study [combat Study]) (Avodart Spl Image 08)](https://ndclist.com/assets/spl/images/960797b3-09b1-4d6a-8ece-8b5d918e93e4/avodart-spl-image-08.jpg)
* These product label images have been analyzed using experimental machine learning. Please verify findings with the primary label text.