Gabapentin Solution
Product Images NDC 81033-123

View Photos of Packaging, Regulatory Labels, and Product Appearance

Product Visual Gallery

This gallery contains 9 technical images submitted to the FDA as part of the official labeling for Gabapentin (NDC 81033-123). Unlike standard consumer photos, these assets often include clinical data figures, molecular chemical structures, and official manufacturer packaging layouts.

As provided by Kesin Pharma Corporation, these visuals offer a comprehensive scientific overview of the product's physical and chemical identity, aiding pharmacists and researchers in product verification and study.

FDA Label Image

Gabapentin Oral Solution 16 Oz Bottle Label (Gabapentin Os Bottle 250mg)

Gabapentin Oral Solution 16 Oz Bottle Label (Gabapentin Os Bottle 250mg)
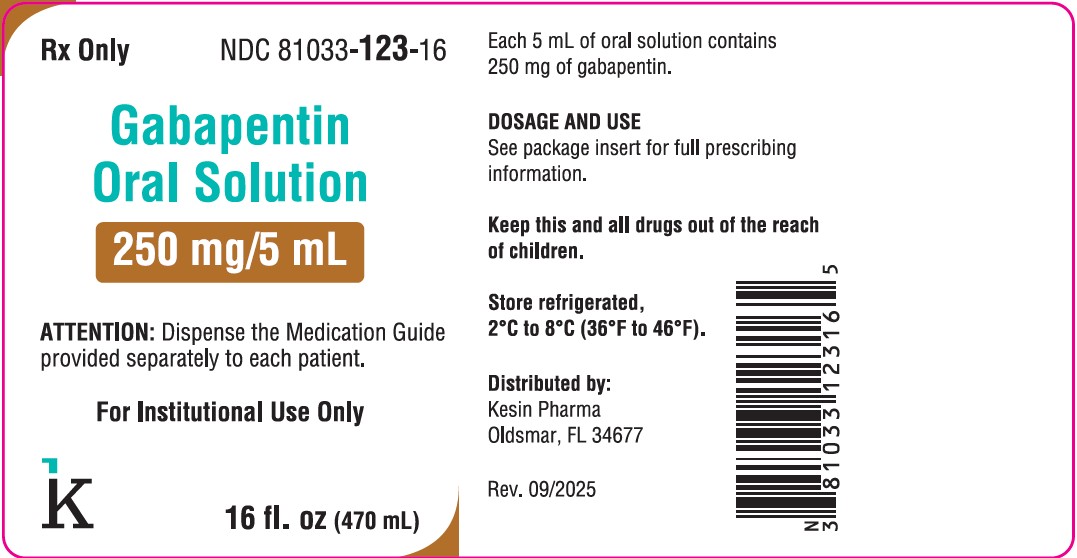
This is a prescription medication for oral use called Gabapentin Oral Solution. Each 5 mL of the solution contains 250 mg of gabapentin. The medication guide should be dispensed separately to each patient. It is recommended for institutional use only. The dosage and usage instructions can be found in the package insert. The solution should be kept refrigerated at temperatures between 2°C to 8°C (36°F to 46°F). Distributed by Kesin Pharma in Oldsmar, FL. Revision date: 09/2025.*
FDA Label Image
FDA Label Image
FDA Label Image

Formula (Gabapentin Oral Solution 1)

Formula (Gabapentin Oral Solution 1)
This text appears to be a formula or calculation related to estimating creatinine clearance (CLCr) based on age, weight, and serum creatinine levels. It involves adjustments for age, gender, weight, and serum creatinine concentration to determine the renal function in patients.*
FDA Label Image

Structure (Gabapentin Oral Solution 2)

FDA Label Image

Diagram1 (Gabapentin Oral Solution 3)

Diagram1 (Gabapentin Oral Solution 3)
This text provides information on the Mean Pain Score over a period of 8 weeks in a study comparing Placebo versus Gabapentin 3600 mg/day. The text outlines a dose titration period followed by a fixed dose period, with the Mean Pain Score being recorded weekly.*
FDA Label Image

Diagram2 (Gabapentin Oral Solution 4)

Diagram2 (Gabapentin Oral Solution 4)
This information provides data on the Mean Pain Score at various stages of a study involving different dose levels of Gabapentin and a Placebo. The study includes a 3-week Dose Titration Period followed by a 4-week Fixed Dose Period. The Mean Pain Scores are presented for Baseline, 1 week, and subsequent weeks, based on the different dose levels of Gabapentin (1800 mg/day and 2400 mg/day) as well as the Placebo.*
FDA Label Image

Diagram3 (Gabapentin Oral Solution 5)

Diagram3 (Gabapentin Oral Solution 5)
This text seems to represent statistical values related to two different studies. The percentage figures range between 0% to 100% and possibly indicate levels of significance. One study involved comparisons between PBO and GBP at different amounts (3600, 1800, and 2400). The asterisks could suggest statistical significance levels (*p<0.01, **p<0.001). The data might be illustrating the outcomes or findings of these two studies in a comparative manner based on the values provided.*
FDA Label Image

Diagram4 (Gabapentin Oral Solution 6)

* These product label images have been analyzed using experimental machine learning. Please verify findings with the primary label text.