Gabapentin Capsule
Product Images NDC 81279-126

View Photos of Packaging, Regulatory Labels, and Product Appearance

Product Visual Gallery

This gallery contains 7 technical images submitted to the FDA as part of the official labeling for Gabapentin (NDC 81279-126). Unlike standard consumer photos, these assets often include clinical data figures, molecular chemical structures, and official manufacturer packaging layouts.

As provided by Pangea Pharmaceuticals, Llc, these visuals offer a comprehensive scientific overview of the product's physical and chemical identity, aiding pharmacists and researchers in product verification and study.

FDA Label Image

Equation (Equation)

Equation (Equation)
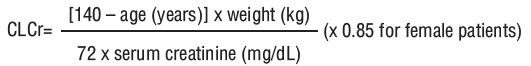
This text contains formulas for estimating creatinine clearance (CLCr) based on age, weight, and serum creatinine levels. The formula varies slightly for female patients. The calculation involves multiplying age and weight, and then applying these values to the formula. The result can provide an estimate of creatinine clearance, which is an important indicator of kidney function.*
FDA Label Image

Figure 1 (Figure 1)

Figure 1 (Figure 1)
This description provides a visual representation of the weekly mean pain scores observed in Study 1 for different treatment groups. It shows the mean pain scores over time for a placebo group and a group receiving 3600 mg/day of Gabapentin. The graph also includes information about the dose titration period and the fixed dose period.*
FDA Label Image

Figure 2 (Figure 2)

Figure 2 (Figure 2)
This is a description of a study comparing weekly mean pain scores among different treatment groups over a period of time. The study includes a dose titration period and a fixed dose period for each treatment group (Placebo, Gabapentin 1800 mg/day, Gabapentin 2400 mg/day). The figure appears to show the baseline pain scores and the progression of pain scores over time.*
FDA Label Image

Figure 3 (Figure 3)

Figure 3 (Figure 3)
This is a chart showing the proportion of responders (patients with over 50% reduction in pain score) at the endpoint of controlled PHN studies. It displays the percentage of responders in different study groups and treatment doses, with indications for statistical significance and study identifiers.*
FDA Label Image

Figure 4 (Figure 4)

Figure 4 (Figure 4)
This text mentions a figure displaying the Responder Rate in Patients Receiving Gabapentin expressed as a difference from Placebo by Dose and Study. It specifically focuses on Adjunctive Therapy Studies in Patients over 12 years of age with Partial Seizures. The figure shows the difference in percentage for different doses of Gabapentin (600mg, 900mg, 1200mg, and 1800mg) compared to a placebo. Two studies, referred to as Study A and Study B, are mentioned in the text.*
FDA Label Image

Gabapentine Capsule 200mg (Gabapentin 200mg)

Gabapentine Capsule 200mg (Gabapentin 200mg)
The text provides information about a medication called Gabapentin. Each capsule contains 200 mg of Gabapentin. The medication guide can be found at the website provided. It also includes details on storage conditions, manufacturer, dosage, and usage instructions. It is important to dispense the medication guide separately to each patient and store the capsules in a child-resistant container.*
FDA Label Image

Structure (Structure)

* These product label images have been analyzed using experimental machine learning. Please verify findings with the primary label text.