Liraglutide Injection, Solution
Product Images NDC 81607-018

View Photos of Packaging, Regulatory Labels, and Product Appearance

Product Visual Gallery

This gallery contains 28 technical images submitted to the FDA as part of the official labeling for Liraglutide (NDC 81607-018). Unlike standard consumer photos, these assets often include clinical data figures, molecular chemical structures, and official manufacturer packaging layouts.

As provided by Orbicular Pharmaceutical Technologies Private Limited, these visuals offer a comprehensive scientific overview of the product's physical and chemical identity, aiding pharmacists and researchers in product verification and study.

FDA Label Image

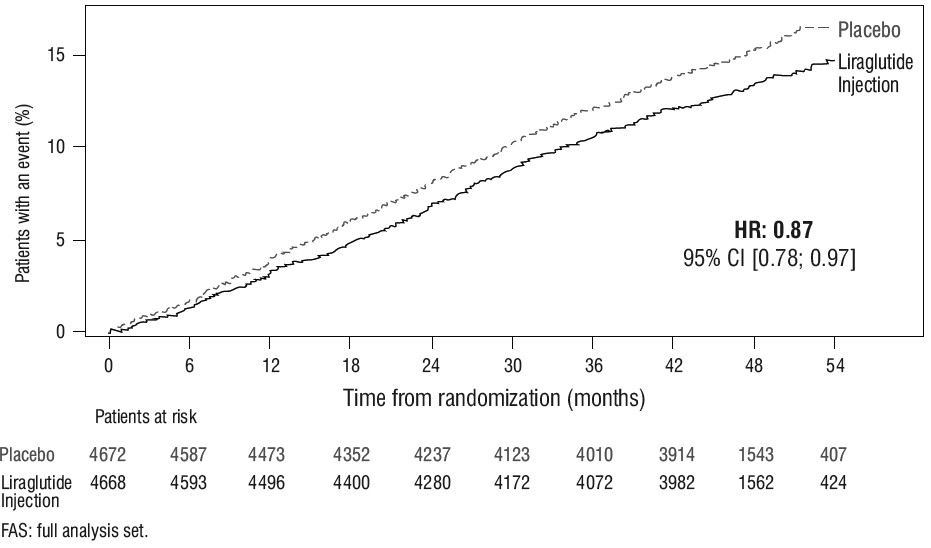
Figure 1 (026b3564 4bf1 4f85 B7c7 Abd03c8d9c3d 01)
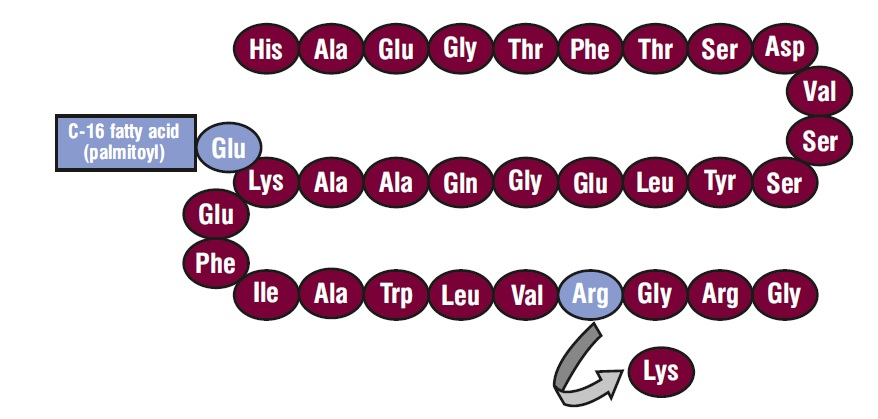
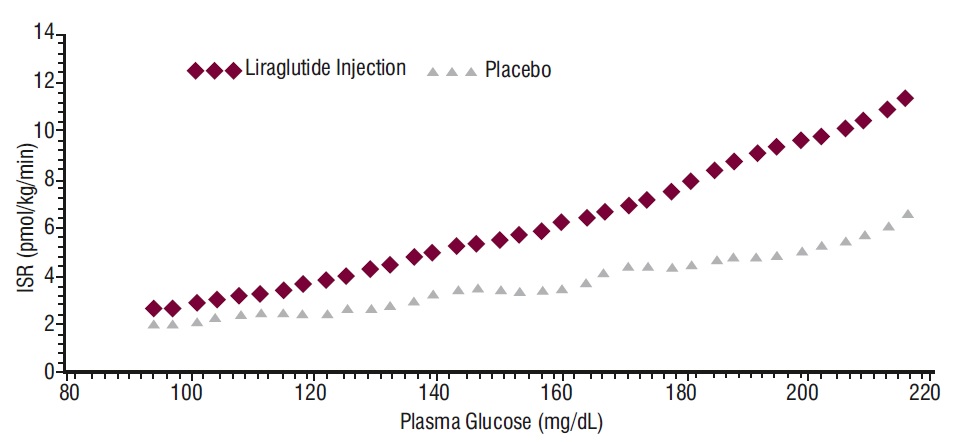
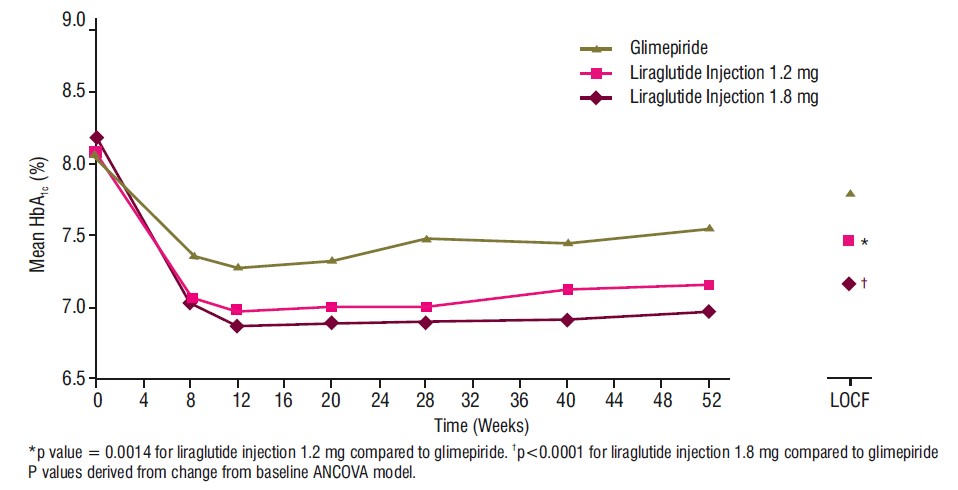
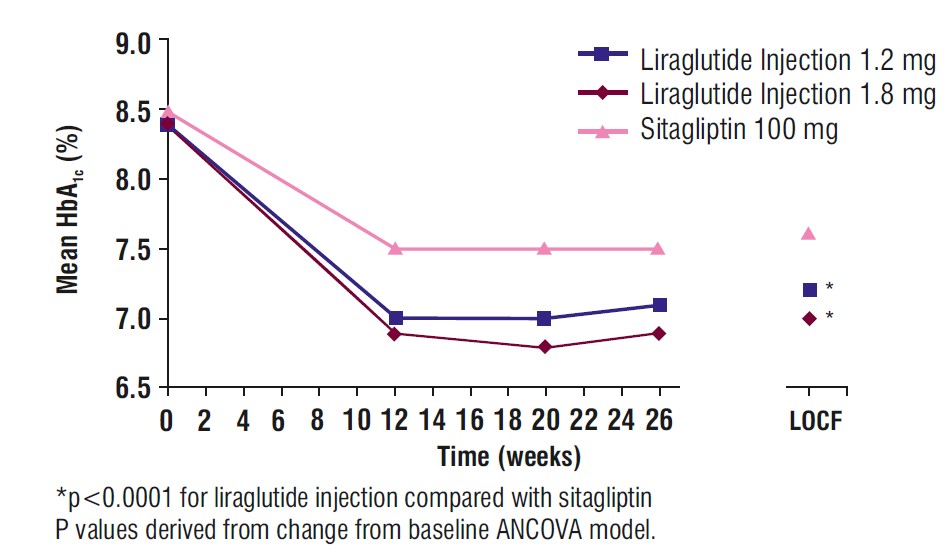
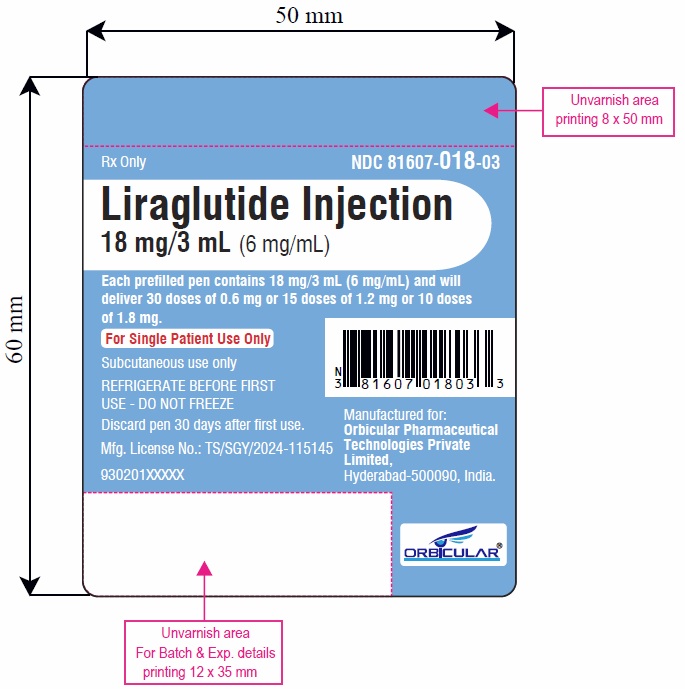
FDA Label Image

Figure 2 (026b3564 4bf1 4f85 B7c7 Abd03c8d9c3d 02)

Figure 2 (026b3564 4bf1 4f85 B7c7 Abd03c8d9c3d 02)
This is a comparison between Liraglutide Injection and Placebo in terms of their effects on Plasma Glucose levels (measured in mg/dL) at different time points (100, 120, 140, 160). The data allows for the evaluation of the impact of Liraglutide Injection on glucose control compared to a placebo.*
FDA Label Image

Figure 3 (026b3564 4bf1 4f85 B7c7 Abd03c8d9c3d 03)

Figure 3 (026b3564 4bf1 4f85 B7c7 Abd03c8d9c3d 03)
This is not-readable.*
FDA Label Image

Figure 4 (026b3564 4bf1 4f85 B7c7 Abd03c8d9c3d 04)

Figure 4 (026b3564 4bf1 4f85 B7c7 Abd03c8d9c3d 04)
This text provides information related to the comparison of different medications for the treatment of a certain condition over a time period of weeks. It mentions the dosage of Liraglutide injection in 1.2 mg and 1.8 mg, Sitagliptin dosage in 100 mg, and a statistical comparison showing the significance of Liraglutide injection compared to Sitagliptin. Statistical significance is indicated by the p-value provided in the text. Time progression is also demonstrated in the graph at the bottom.*
FDA Label Image

Figure 5 (026b3564 4bf1 4f85 B7c7 Abd03c8d9c3d 05)

Figure 5 (026b3564 4bf1 4f85 B7c7 Abd03c8d9c3d 05)
This text provides data on a clinical trial comparing Liraglutide injection to Placebo in a study involving a period of several months. It captures patient counts at various time points from randomization, along with corresponding hazard ratios and their confidence intervals. The study includes a full analysis set and indicates the number of patients at risk during each time point.*
FDA Label Image

Ifu Image (026b3564 4bf1 4f85 B7c7 Abd03c8d9c3d 06)

Ifu Image (026b3564 4bf1 4f85 B7c7 Abd03c8d9c3d 06)
This is a description of a liraglutide injection pen. The pen features a rubber cartridge, a stopper, dose scale display, dose pointer, flow check, pen cap, dose selector, injector, and a needle. If experiencing issues with the pen, there is a toll-free number provided for assistance.*
FDA Label Image

Carton3s (026b3564 4bf1 4f85 B7c7 Abd03c8d9c3d 07)

FDA Label Image

Carton2s (026b3564 4bf1 4f85 B7c7 Abd03c8d9c3d 08)

Carton2s (026b3564 4bf1 4f85 B7c7 Abd03c8d9c3d 08)
This text appears to be related to the product "Liraglutide Injection" in various quantities ranging from 18mg/3mL to 165mm. It includes different dosages and measurements for this injection solution. It seems to also include information about how to use or administer the injection.*
FDA Label Image

Label (026b3564 4bf1 4f85 B7c7 Abd03c8d9c3d 09)

Label (026b3564 4bf1 4f85 B7c7 Abd03c8d9c3d 09)
This is a description of a Liraglutide Injection product, with a concentration of 18 mg/3 mL (6 mg/mL). The prefilled pen contains 18 mg/3 mL and will deliver various doses ranging from 0.6 mg to 1.8 mg. The product should be refrigerated before the first use and should not be frozen. The pen should be discarded 30 days after the first use. The text also includes details such as the pharmaceutical license number, manufacturing location in Hyderabad, India, and recommended printing areas for batch and expiration details.*
FDA Label Image

Image (026b3564 4bf1 4f85 B7c7 Abd03c8d9c3d 152 10)

FDA Label Image

Image (026b3564 4bf1 4f85 B7c7 Abd03c8d9c3d 152 11)

FDA Label Image

Image (026b3564 4bf1 4f85 B7c7 Abd03c8d9c3d 152 12)

FDA Label Image

Image (026b3564 4bf1 4f85 B7c7 Abd03c8d9c3d 152 13)

FDA Label Image

Image (026b3564 4bf1 4f85 B7c7 Abd03c8d9c3d 152 14)

FDA Label Image

Image (026b3564 4bf1 4f85 B7c7 Abd03c8d9c3d 152 15)

FDA Label Image

Image (026b3564 4bf1 4f85 B7c7 Abd03c8d9c3d 152 16)

FDA Label Image

Image (026b3564 4bf1 4f85 B7c7 Abd03c8d9c3d 152 17)

FDA Label Image

Image (026b3564 4bf1 4f85 B7c7 Abd03c8d9c3d 152 18)

FDA Label Image

Image (026b3564 4bf1 4f85 B7c7 Abd03c8d9c3d 152 19)

FDA Label Image

Image (026b3564 4bf1 4f85 B7c7 Abd03c8d9c3d 152 2)

FDA Label Image

Image (026b3564 4bf1 4f85 B7c7 Abd03c8d9c3d 152 20)

FDA Label Image

Image (026b3564 4bf1 4f85 B7c7 Abd03c8d9c3d 152 3)

FDA Label Image

Image (026b3564 4bf1 4f85 B7c7 Abd03c8d9c3d 152 4)

FDA Label Image

Image (026b3564 4bf1 4f85 B7c7 Abd03c8d9c3d 152 5)

FDA Label Image

Image (026b3564 4bf1 4f85 B7c7 Abd03c8d9c3d 152 6)

FDA Label Image

Image (026b3564 4bf1 4f85 B7c7 Abd03c8d9c3d 152 7)

FDA Label Image

Image (026b3564 4bf1 4f85 B7c7 Abd03c8d9c3d 152 8)

FDA Label Image

Image (026b3564 4bf1 4f85 B7c7 Abd03c8d9c3d 152 9)

* These product label images have been analyzed using experimental machine learning. Please verify findings with the primary label text.