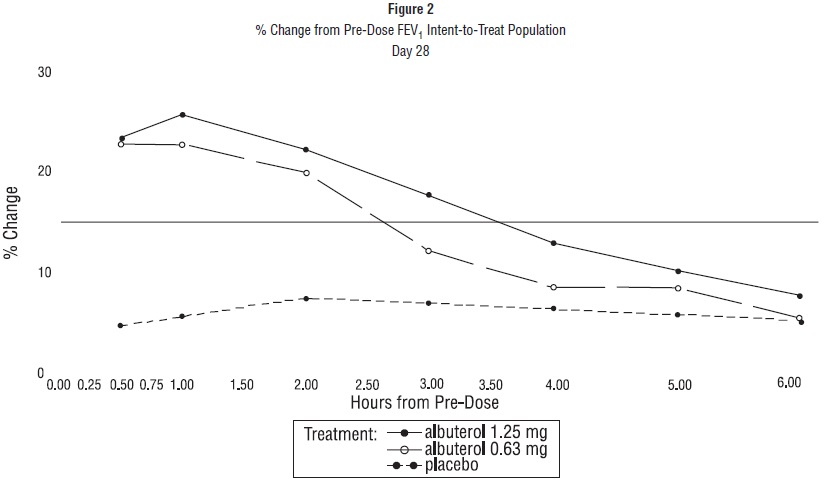
Figure 1 % Change From Pre-dose Fev1 Intent-to-treat Population Day 1 (Albuterol Fig1)
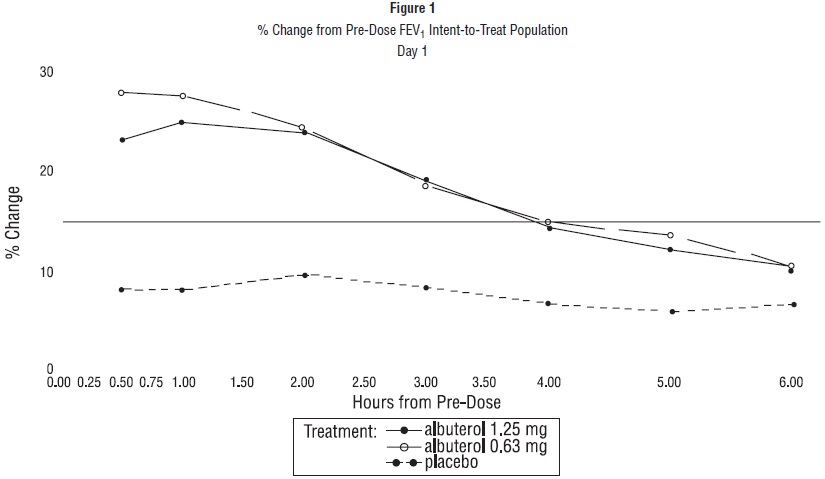
This is a chart showing the % change from the pre-dose FEV in an Intent-to-Treat Population. The chart displays data points for different time periods after the pre-dose treatment with albuterol at two different dosages and a placebo. The x-axis represents the hours from the pre-dose, and the y-axis shows the % change values. The chart includes values at various time points up to 400 hours. The data visualization allows for the comparison of the % change in FEV over time between the different treatments.*