Attruby Tablet, Film Coated
Product Images NDC 82228-712

View Photos of Packaging, Regulatory Labels, and Product Appearance

Product Visual Gallery

This gallery contains 6 technical images submitted to the FDA as part of the official labeling for Attruby (NDC 82228-712). Unlike standard consumer photos, these assets often include clinical data figures, molecular chemical structures, and official manufacturer packaging layouts.

As provided by Bridgebio Pharma, Inc., these visuals offer a comprehensive scientific overview of the product's physical and chemical identity, aiding pharmacists and researchers in product verification and study.

FDA Label Image

Structural Formula (Att00 0001 01)
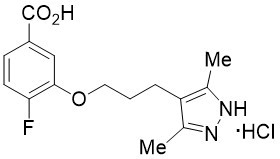
Structural Formula (Att00 0001 01)
Chemical structure of acoramidis hydrochloride showing the molecular arrangement with a fluorophenyl carboxylic acid moiety linked to a methyl-substituted imidazole ring and a hydrochloride component.*
FDA Label Image

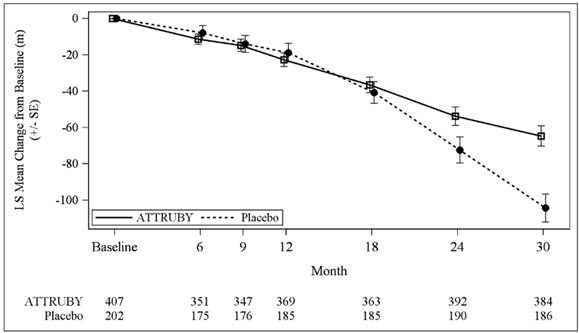
Figure 1 (Att00 0001 02)

Figure 1 (Att00 0001 02)
A line graph comparing LS mean change from baseline over time in months for ATTRUBY (solid line) and placebo (dashed line) groups. The y-axis shows change from baseline in meters, indicating a downward trend for both groups, with ATTRUBY showing less decline than placebo over 30 months. Sample sizes for each time point are listed below the x-axis.*
FDA Label Image

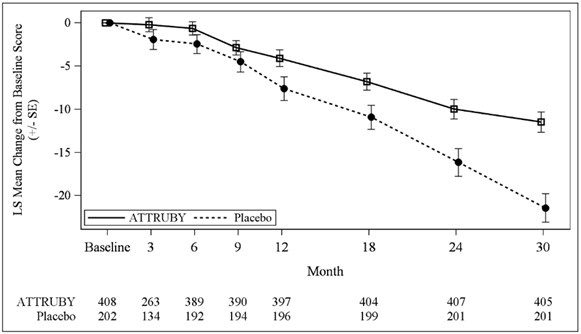
Figure 2 (Att00 0001 03)

Figure 2 (Att00 0001 03)
A line graph comparing the least squares mean change from baseline score over 30 months between Attruby and placebo groups. The x-axis shows time in months, and the y-axis shows the score change with error bars. Attruby is represented by a solid line, and placebo by a dashed line, with participant numbers listed below each time point.*
FDA Label Image

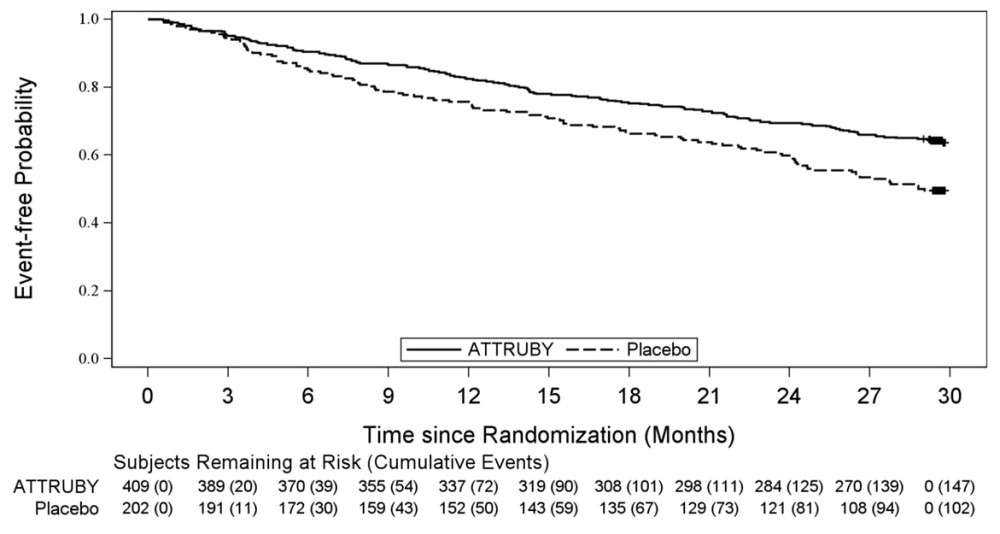
Figure 3 (Att00 0001 04)

Figure 3 (Att00 0001 04)
A Kaplan-Meier survival curve chart showing event-free probability over time since randomization (in months) comparing Attruby (solid line) to placebo (dashed line). The chart includes numbers of subjects remaining at risk and cumulative events for both groups at various time points up to 30 months.*
FDA Label Image

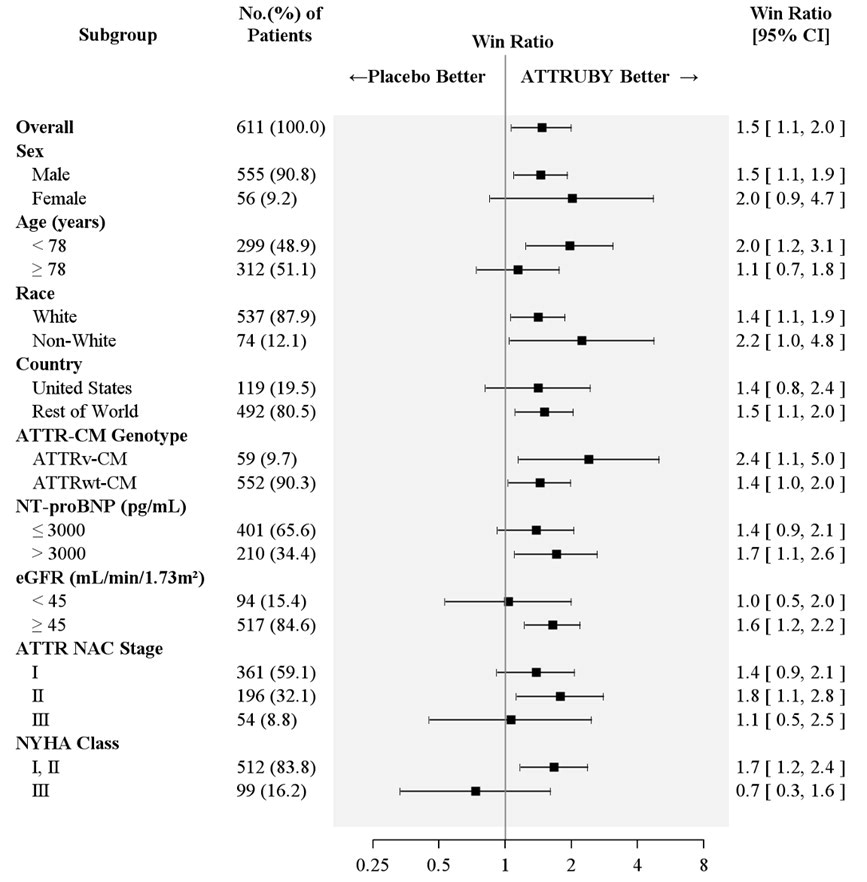
Figure 4 (Att00 0001 05)

Figure 4 (Att00 0001 05)
A forest plot showing the win ratio and 95% confidence intervals for various patient subgroups treated with Attruby compared to placebo. Subgroups include overall population, sex, age, race, country, genotype, biomarker levels, kidney function, disease stage, and heart failure class. The plot indicates whether Attruby or placebo was favored across these categories.*
FDA Label Image

Principal Display Panel – 356 mg Carton Label (Att00 0001 06)

Principal Display Panel – 356 mg Carton Label (Att00 0001 06)
Attruby 356 mg film-coated tablets packaging label displaying acoramidis as the active ingredient, labeled for prescription use. The label shows a purple-themed design with dosage strength, manufacturer BridgeBio Pharma, Inc., and storage instructions. Includes information on tablet count (112 tablets) and a placeholder for pharmacy labels.*

* About these descriptions: Image descriptions on this page are generated by automated AI analysis of the product label images from the manufacturer's FDA label submission (SPL). They are provided for reference only and may contain errors or omissions. Always rely on the printed label itself and the official FDA labeling, and consult a pharmacist or healthcare professional with any questions about this product.