Product Images Pazopanib

View Photos of Packaging, Labels & Appearance

Product Label Images

The following 4 images provide visual information about the product associated with Pazopanib NDC 82293-022 by Novugen Pharma (usa) Llc., such as packaging, labeling, and the appearance of the drug itself. This resource could be helpful for medical professionals, pharmacists, and patients seeking to verify medication information and ensure they have the correct product.

Figure - figure002

Figure - figure002

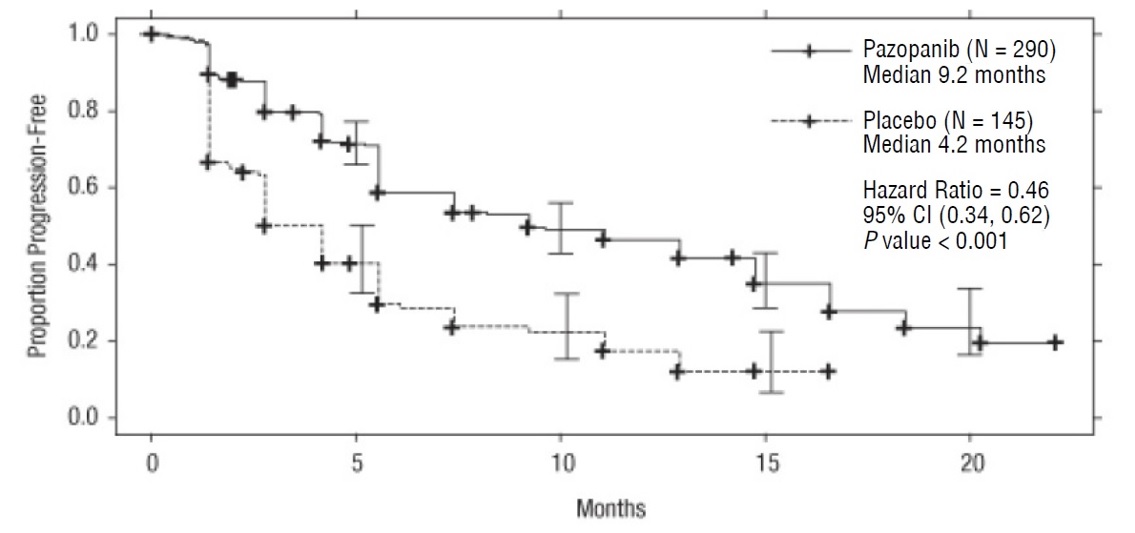
This text provides information about a clinical trial comparing pazopanib to a placebo in terms of progression-free survival. The results show that patients on pazopanib had a median progression-free survival of 4.6 months compared to 1.6 months for those on placebo. The hazard ratio was found to be 0.35 with a 95% confidence interval of 0.26 to 0.48, indicating a significant difference between the two groups (P value < 0.001).*

Figure - figure01

Figure - figure01

Proportion Progression-Free: This data shows the comparison between Pazopanib (administered to 290 subjects) and Placebo (administered to 145 subjects) in terms of median progression-free survival. The results indicate that the median progression-free survival was 9.2 months for Pazopanib and 4.2 months for Placebo. The Hazard Ratio was calculated as 0.46 with a 95% confidence interval of (0.34, 0.62) and a statistically significant p-value of less than 0.001.*

Label - image001 v3

Label - image001 v3

Each tablet of NoC 82263-022-10 contains 200 mg of pazopanib free base equivalent to 216.7 mg of pazopanib hydrochloride. The prescribed dosage should be followed as per the accompanying information. Store the tablets at a temperature between 20°C to 25°C (68°F to 77°F) with excursions permitted between 15°C to 30°C (59°F to 86°F). Ensure the printed safety seal under the cap is intact before use. Pharmacists should dispense the medication guide with each order of 120 tablets.*

chemical structure - structure001

chemical structure - structure001

* The product label images have been analyzed using a combination of traditional computing and machine learning techniques. It should be noted that the descriptions provided may not be entirely accurate as they are experimental in nature. Use the information in this page at your own discretion and risk.