Bexagliflozin Tablet
Product Images NDC 82381-2000

View Photos of Packaging, Regulatory Labels, and Product Appearance

Product Visual Gallery

This gallery contains 6 technical images submitted to the FDA as part of the official labeling for Bexagliflozin (NDC 82381-2000). Unlike standard consumer photos, these assets often include clinical data figures, molecular chemical structures, and official manufacturer packaging layouts.

As provided by Theracosbio, Llc, these visuals offer a comprehensive scientific overview of the product's physical and chemical identity, aiding pharmacists and researchers in product verification and study.

FDA Label Image

Bexagliflozin-label-30s (Bexagliflozin 20 mg 30 Tablets)

Bexagliflozin-label-30s (Bexagliflozin 20 mg 30 Tablets)
Label for Bexagliflozin Tablets 20 mg oral tablets, distributed by TheracosBio, LLC. The label indicates a package quantity of 30 tablets and includes storage instructions, warnings, and a note to dispense the enclosed Medication Guide. The label size measures 100 mm by 36 mm and features barcodes with lot, expiration, and serial number fields.*
FDA Label Image

Bexagliflozin-label-90s (Bexagliflozin 20 mg 90 Tablets)

Bexagliflozin-label-90s (Bexagliflozin 20 mg 90 Tablets)
Bexagliflozin Tablet 20 mg oral tablets packaging label showing 90 tablets per bottle. Label includes storage instructions, warnings against crushing or chewing, distributor TheracosBio, LLC Marlborough, MA, and emphasizes Rx only. The label features a barcode and placeholders for lot, expiration, and serial numbers.*
FDA Label Image

Bexagliflozin-figure-1 (Bexagliflozin Figure 1)

Bexagliflozin-figure-1 (Bexagliflozin Figure 1)
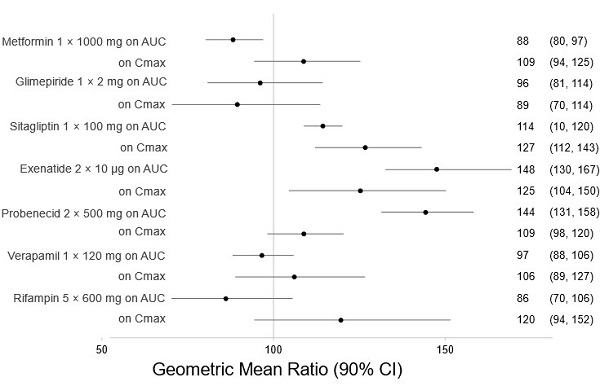
A scatter plot with error bars depicting the geometric mean ratios (90% confidence intervals) for AUC and Cmax of various drugs including Metformin, Glimepiride, Sitagliptin, Exenatide, Probenecid, Verapamil, and Rifampin. The x-axis is labeled 'Geometric Mean Ratio (90% CI)' with values ranging approximately from 50 to 160.*
FDA Label Image

Bexagliflozin-figure-2 (Bexagliflozin Figure 2)

Bexagliflozin-figure-2 (Bexagliflozin Figure 2)
A forest plot chart showing the geometric mean ratio with 90% confidence intervals for AUC and Cmax values of Bexagliflozin in combination with various drugs: Metformin, Glimepiride, Sitagliptin, and Digoxin. The x-axis is labeled 'Geometric Mean Ratio (90% CI)' with values ranging from 50 to 150.*
FDA Label Image

Bexagliflozin-figure-3 (Bexagliflozin Figure 3)

Bexagliflozin-figure-3 (Bexagliflozin Figure 3)
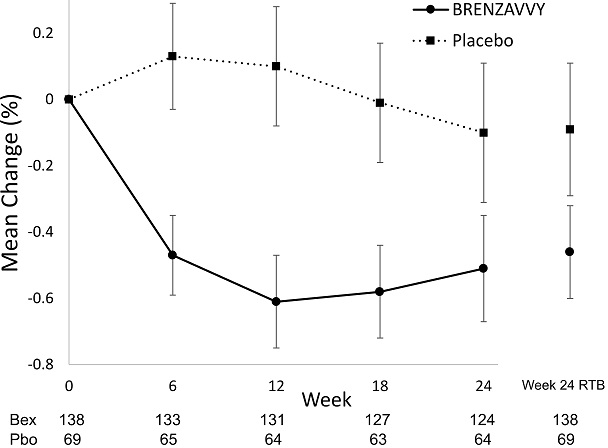
Line graph showing mean percentage change over 24 weeks comparing the drug BRENZAVVY and placebo. The x-axis represents time in weeks, and the y-axis shows mean change in percent. BRENZAVVY data points are marked with circles and placebo with squares, each with error bars. A sample size table is included below the x-axis for both groups at different weeks.*
FDA Label Image

Bexagliflozin-structure (Bexagliflozin Structure)

Bexagliflozin-structure (Bexagliflozin Structure)
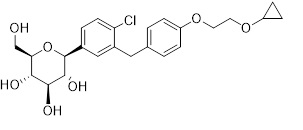
Chemical structure of Bexagliflozin, showing its molecular framework with hydroxyl, chlorine, ether, and cyclopropyl functional groups.*

* About these descriptions: Image descriptions on this page are generated by automated AI analysis of the product label images from the manufacturer's FDA label submission (SPL). They are provided for reference only and may contain errors or omissions. Always rely on the printed label itself and the official FDA labeling, and consult a pharmacist or healthcare professional with any questions about this product.