Eliquis Tablet, Film Coated
Product Images NDC 82804-085

View Photos of Packaging, Regulatory Labels, and Product Appearance

Product Visual Gallery

This gallery contains 7 technical images submitted to the FDA as part of the official labeling for Eliquis (NDC 82804-085). Unlike standard consumer photos, these assets often include clinical data figures, molecular chemical structures, and official manufacturer packaging layouts.

As provided by Proficient Rx Lp, these visuals offer a comprehensive scientific overview of the product's physical and chemical identity, aiding pharmacists and researchers in product verification and study.

FDA Label Image

82804-085-30 (Apixa 5.0mg Label.jpg.jpg)

82804-085-30 (Apixa 5.0mg Label.jpg.jpg)
Label for Eliquis 5 mg film-coated tablets by Proficient Rx LP. Bottle contains 30 tablets. Each tablet contains 5 mg of apixaban. Tablets are described as pink, oval, biconvex, debossed with "894" on one side and "5" on the other. Marketed by Bristol-Myers Squibb Company and Pfizer Inc. Storage instructions specify 20°-25°C (68°-77°F). Label includes barcode, QR codes, and multiple NDC identifiers.*
FDA Label Image

Apixaban Chemical Structure (Apixaban Struct)

Apixaban Chemical Structure (Apixaban Struct)
Chemical structure of apixaban, the active ingredient in ELIQUIS 5 mg film-coated tablets. The structure features multiple fused rings, including a benzene ring, a pyrazole ring, and other heterocyclic components along with functional groups such as an amide and methoxy substituent.*
FDA Label Image

Aristotle Forest Plot (Eliquis Clin Forest Fig5)

Aristotle Forest Plot (Eliquis Clin Forest Fig5)
A forest plot representing subgroup analysis comparing the hazard ratio of apixaban versus warfarin across various patient subgroups including age, sex, weight, prior stroke or TIA, diabetes status, CHADS2 score, creatinine clearance, geographic region, and aspirin use at randomization. The plot shows hazard ratios with 95% confidence intervals and event rates for apixaban and warfarin for each subgroup.*
FDA Label Image

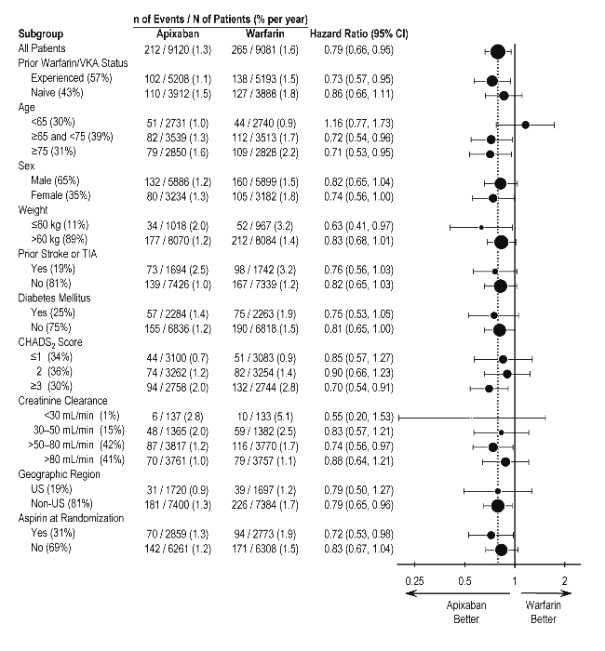
Aristotle Major Bleeding Forest Plot (Eliquis Forest Fig1)

Aristotle Major Bleeding Forest Plot (Eliquis Forest Fig1)
A forest plot comparing the number of events per number of patients per year and hazard ratios with 95% confidence intervals for apixaban versus warfarin across various subgroups. Subgroups include age, sex, weight, prior stroke or TIA, diabetes mellitus, CHADS2 score, creatinine clearance, geographic region, and aspirin use. The plot visually represents the comparative effectiveness and safety of apixaban relative to warfarin.*
FDA Label Image

Aristotle Kaplan-meier Curve (Eliquis Km Fig4)

Aristotle Kaplan-meier Curve (Eliquis Km Fig4)
A Kaplan-Meier curve comparing ELIQUIS and Warfarin showing the proportion of subjects with stroke or systemic embolism over 36 months. The graph plots time in months on the x-axis against the proportion of subjects experiencing events on the y-axis. The chart includes event counts and numbers at risk for both treatments at various time points, along with a p-value and hazard ratio indicating statistical comparison.*
FDA Label Image

Effect Of Coadministered Drugs On Pharmacokinetics Of Apixaban (Eliquis Pkplot Drugs Fig2)

Effect Of Coadministered Drugs On Pharmacokinetics Of Apixaban (Eliquis Pkplot Drugs Fig2)
A scatter plot chart displaying the fold change and 90% confidence intervals in pharmacokinetic parameters Cmax and AUC for various interacting drugs with apixaban. The chart compares the effects of combined P-gp and strong CYP3A4 inhibitors (ketoconazole, clarithromycin), other CYP3A4 and P-gp inhibitors (diltiazem, naproxen), and a combined P-gp and strong CYP3A4 inducer (rifampin) relative to a reference.*
FDA Label Image

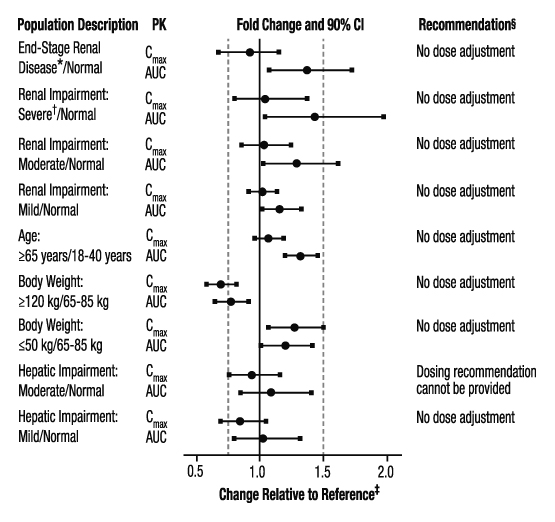
O:\e-submissions\pbo\products\eliquis 202155\08. Pas Esrd Dosing\01. Orig Submission\source\eliquis-pkplot-pop-fig3.jpg (Eliquis Pkplot Pop Fig3)

O:\e-submissions\pbo\products\eliquis 202155\08. Pas Esrd Dosing\01. Orig Submission\source\eliquis-pkplot-pop-fig3.jpg (Eliquis Pkplot Pop Fig3)
A figure showing fold change and 90% confidence intervals for pharmacokinetic parameters (Cmax and AUC) of apixaban in various populations, including end-stage renal disease, renal impairment levels, age groups, body weight categories, and hepatic impairment. Recommendations regarding dose adjustment are listed for each population, with most indicating no dose adjustment except for moderate hepatic impairment where dosing recommendation cannot be provided.*

* About these descriptions: Image descriptions on this page are generated by automated AI analysis of the product label images from the manufacturer's FDA label submission (SPL). They are provided for reference only and may contain errors or omissions. Always rely on the printed label itself and the official FDA labeling, and consult a pharmacist or healthcare professional with any questions about this product.