Gabapentin Tablet
Product Images NDC 82804-193

View Photos of Packaging, Regulatory Labels, and Product Appearance

Product Visual Gallery

This gallery contains 7 technical images submitted to the FDA as part of the official labeling for Gabapentin (NDC 82804-193). Unlike standard consumer photos, these assets often include clinical data figures, molecular chemical structures, and official manufacturer packaging layouts.

As provided by Proficient Rx Lp, these visuals offer a comprehensive scientific overview of the product's physical and chemical identity, aiding pharmacists and researchers in product verification and study.

FDA Label Image

Clcr (Equation)

Clcr (Equation)
A formula for calculating creatinine clearance (CLCr), involving age in years, weight in kilograms, and serum creatinine in mg/dL, with a multiplication factor for female patients. This is likely part of dosing or pharmacokinetic information but does not include specific drug details.*
FDA Label Image

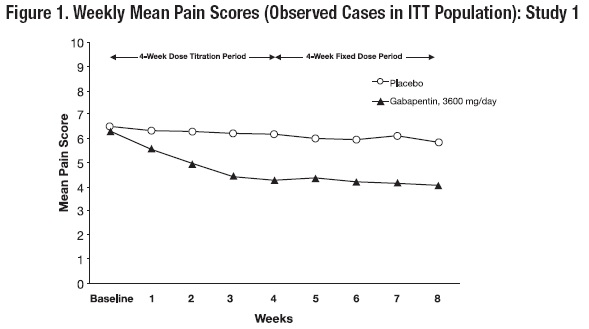
Figure-1 (Figure1)

Figure-1 (Figure1)
A line graph depicting weekly mean pain scores over 8 weeks comparing placebo and Gabapentin 3600 mg/day. The x-axis shows weeks from baseline to week 8, and the y-axis shows mean pain scores from 0 to 10. The chart illustrates a decrease in pain scores for Gabapentin over time, while placebo scores remain relatively stable.*
FDA Label Image

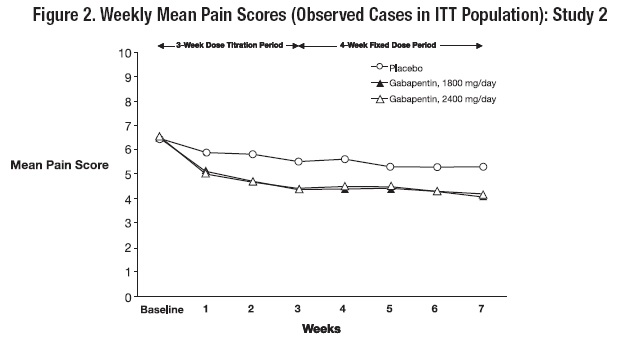
Figure-2 (Figure2)

Figure-2 (Figure2)
A line graph titled 'Weekly Mean Pain Scores (Observed Cases in ITT Population): Study 2' showing mean pain scores over 7 weeks. The x-axis represents weeks with a baseline and weeks 1 to 7. The y-axis measures mean pain scores from 0 to 10. The graph compares three groups: Placebo, Gabapentin 1800 mg/day, and Gabapentin 2400 mg/day, across a 3-week dose titration period and a 4-week fixed dose period. Scores decrease over time for Gabapentin groups compared to placebo.*
FDA Label Image

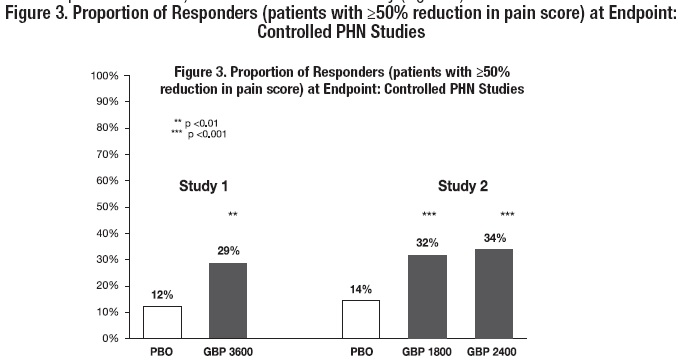
Figure-3 (Figure3)

Figure-3 (Figure3)
A bar chart titled 'Proportion of Responders (patients with ≥50% reduction in pain score) at Endpoint: Controlled PHN Studies' showing data from two studies. Study 1 compares placebo (12%) and Gabapentin 3600 mg (29% responders). Study 2 compares placebo (14%), Gabapentin 1800 mg (32%), and Gabapentin 2400 mg (34%) responders. Statistical significance is indicated for gabapentin groups versus placebo.*
FDA Label Image

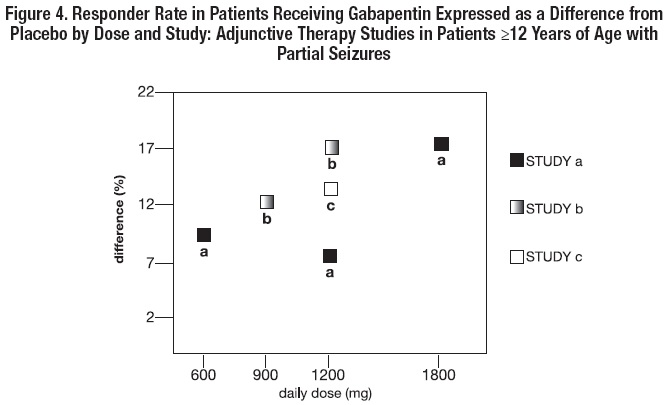
Figure-4 (Figure4)

Figure-4 (Figure4)
A scatter plot showing the responder rate difference (%) from placebo by daily dose of gabapentin (mg) in adjunctive therapy studies for patients aged 12 years and older with partial seizures. The graph presents data points for three studies (a, b, and c) at doses of 600, 900, 1200, and 1800 mg, illustrating differences ranging roughly from 7% to 18%.*
FDA Label Image

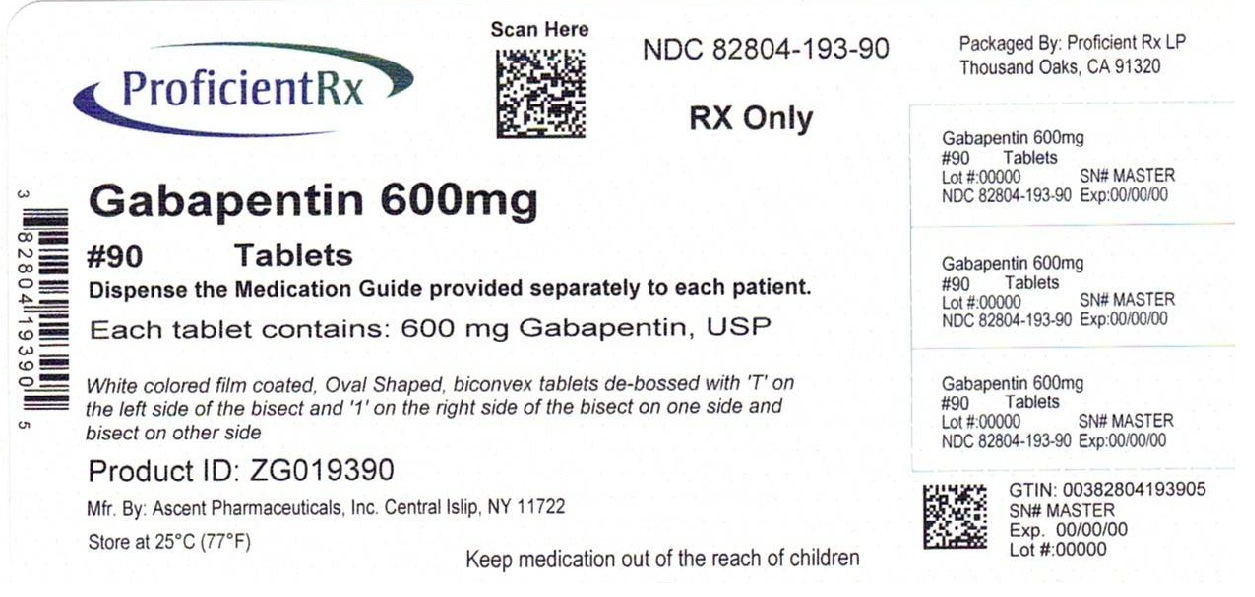
82804-193-90 (Image 01)

82804-193-90 (Image 01)
Label for Gabapentin 600 mg tablets by Proficient Rx LP, NDC 82804-193, packaged count 90 tablets. White, oval-shaped, film-coated tablets with identification markings. The label includes barcode, lot number, expiration date placeholders, and storage instructions at 25°C. Manufactured by Ascent Pharmaceuticals, Inc., Central Islip, NY.*
FDA Label Image

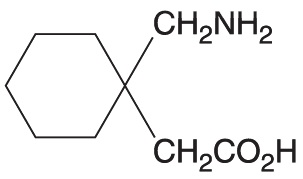
Struc (Struct)

Struc (Struct)
Chemical structure diagram of Gabapentin, showing a cyclohexane ring attached to a carbon bonded to amino and carboxyl functional groups.*

* About these descriptions: Image descriptions on this page are generated by automated AI analysis of the product label images from the manufacturer's FDA label submission (SPL). They are provided for reference only and may contain errors or omissions. Always rely on the printed label itself and the official FDA labeling, and consult a pharmacist or healthcare professional with any questions about this product.