Divalproex Sodium Tablet, Delayed Release
Product Images NDC 82804-233

View Photos of Packaging, Regulatory Labels, and Product Appearance

Product Visual Gallery

This gallery contains 6 technical images submitted to the FDA as part of the official labeling for Divalproex Sodium (NDC 82804-233). Unlike standard consumer photos, these assets often include clinical data figures, molecular chemical structures, and official manufacturer packaging layouts.

As provided by Proficient Rx Lp, these visuals offer a comprehensive scientific overview of the product's physical and chemical identity, aiding pharmacists and researchers in product verification and study.

FDA Label Image

Structure (Divalproex Sodium De Figure 1)

Structure (Divalproex Sodium De Figure 1)
Chemical structure diagram of divalproex sodium, showing the molecular arrangement of its components including sodium salt and branched alkyl groups.*
FDA Label Image

Figure1 (Divalproex Sodium De Figure 2)

Figure1 (Divalproex Sodium De Figure 2)
A bar chart comparing percentages labeled as PBO and DVPX across two studies (Study 1 and Study 2). Study 1 and Study 2 percentages are shown on the x-axis with the y-axis labeled as a percentage scale ranging from 0% to 70%. DVPX bars show higher percentages (60% and 58%) compared to PBO bars (26% and 29%) in both studies.*
FDA Label Image

Figure2 (Divalproex Sodium De Figure 3)

Figure2 (Divalproex Sodium De Figure 3)
A line graph comparing the percentage of patients and percent reduction in CPS rate between divalproex sodium and placebo. The y-axis represents percent reduction in CPS rate from -100% to 100%, with lines indicating improvement or worsening. The x-axis denotes the percentage of patients from 0 to 100%, showing distinct curves for divalproex sodium (solid line) and placebo (dashed line).*
FDA Label Image

Figure3 (Divalproex Sodium De Figure 4)

Figure3 (Divalproex Sodium De Figure 4)
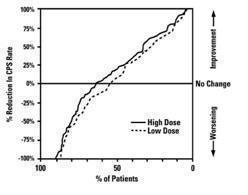
A line graph showing percentage reduction in CPR rate versus percent of patients for high and low doses. The vertical axis measures reduction in CPR rate from -100% to 100%, with arrows indicating 'Worsening' at the bottom and 'Improvement' at the top. The horizontal axis represents percent of patients from 0 to 100%. Solid and dashed lines depict data for high and low doses respectively.*
FDA Label Image

Figure4 (Divalproex Sodium De Figure 5)

Figure4 (Divalproex Sodium De Figure 5)
Bar chart comparing results between placebo and divalproex sodium in two studies. The y-axis represents a measured value ranging from 0 to 6, while the x-axis separates the data for Study 1 and Study 2. Each study displays two bars labeled Placebo and Divalproex sodium, showing differences in the measured outcome between these groups.*
FDA Label Image

82804-233-30 (Image 01)

82804-233-30 (Image 01)
Label for Divalproex 250 mg delayed-release tablets by Proficient Rx LP. The package contains 30 enteric-coated tablets equivalent to 250 mg valproic acid each. Tablets are pale brown, mottled, oval biconvex with '512' imprint. Distributed by Bionpharma Inc., Princeton, NJ, made in India.*

* About these descriptions: Image descriptions on this page are generated by automated AI analysis of the product label images from the manufacturer's FDA label submission (SPL). They are provided for reference only and may contain errors or omissions. Always rely on the printed label itself and the official FDA labeling, and consult a pharmacist or healthcare professional with any questions about this product.