Product Images Gabapentin

View Photos of Packaging, Labels & Appearance

Product Label Images

The following 7 images provide visual information about the product associated with Gabapentin NDC 82868-051 by Northwind Pharmaceuticals, Llc, such as packaging, labeling, and the appearance of the drug itself. This resource could be helpful for medical professionals, pharmacists, and patients seeking to verify medication information and ensure they have the correct product.

82868-051-30 - 82868 051 30 Rev A 06 24

82868-051-30 - 82868 051 30   Rev A 06 24

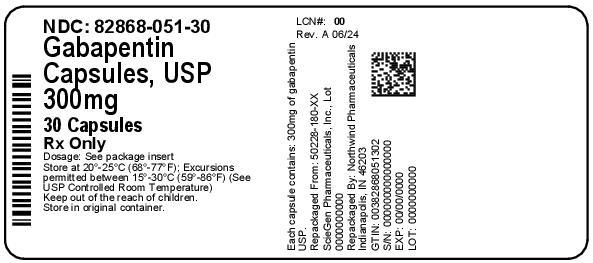
This is a description of Gabapentin capsules, with a strength of 300mg per capsule. The pack contains 30 capsules and is available by prescription only. The NDC code for this medication is 82868-051-30. The text seems to include dosage information and a caution to keep the medication out of reach. The also captures some illegible characters and numbers after the caution.*

Figure 1 - image 01

Figure 1 - image 01

Figure 2 - image 02

Figure 2 - image 02

This is a graph showing the mean pain score over 7 weeks for a study comparing a placebo with two dosages of Gabapentin (1800 mg/day and 2400 mg/day). The graph displays the baseline and the pain scores for each week, indicating the effect of the different doses over time.*

Figure 3 - image 03

Figure 3 - image 03

This text provides information about the proportion of responders (patients with a greater-than-or-equal-to 50% reduction in pain score) at the endpoint in controlled studies on postherpetic neuralgia. Study 1 shows a 34% response rate for PBO (placebo), 29% for GBP 3600, and 32% for PBO GBP 1800. Study 2 shows a significant statistical difference with p-values of less than 0.001 and 0.001 for GBP 3600 and GBP 1800, respectively.*

Cockcroft and Gault Equation - image 04

Cockcroft and Gault Equation - image 04

Gabapentin Structural Formula - image 05

Gabapentin Structural Formula - image 05

image-09 - image 09

image-09 - image 09

This text provides a table showing the relationship between the daily dose in milligrams of a substance and the corresponding levels of its effects. The table ranges from 600 to 1600 mg daily dose, indicating the impact of dosage on the outcome.*

* The product label images have been analyzed using a combination of traditional computing and machine learning techniques. It should be noted that the descriptions provided may not be entirely accurate as they are experimental in nature. Use the information in this page at your own discretion and risk.