Lacosamide Injection
Product Images NDC 83090-012

View Photos of Packaging, Regulatory Labels, and Product Appearance

Product Visual Gallery

This gallery contains 5 technical images submitted to the FDA as part of the official labeling for Lacosamide (NDC 83090-012). Unlike standard consumer photos, these assets often include clinical data figures, molecular chemical structures, and official manufacturer packaging layouts.

As provided by Sintetica Us Llc, these visuals offer a comprehensive scientific overview of the product's physical and chemical identity, aiding pharmacists and researchers in product verification and study.

FDA Label Image

Figure 3 (Lacosamide 014)
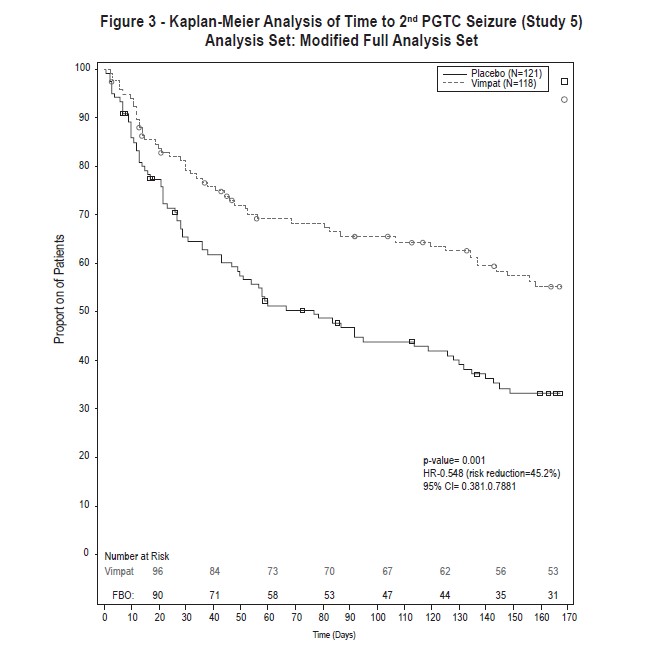
Figure 3 (Lacosamide 014)
A Kaplan-Meier survival curve chart showing analysis of time to second PGTC seizure comparing placebo and Vimpatt groups over time in days. The y-axis represents the proportion of patients, and the x-axis represents time in days. The chart includes risk numbers at various time points and statistical data such as p-value, hazard ratio, and confidence interval.*
FDA Label Image

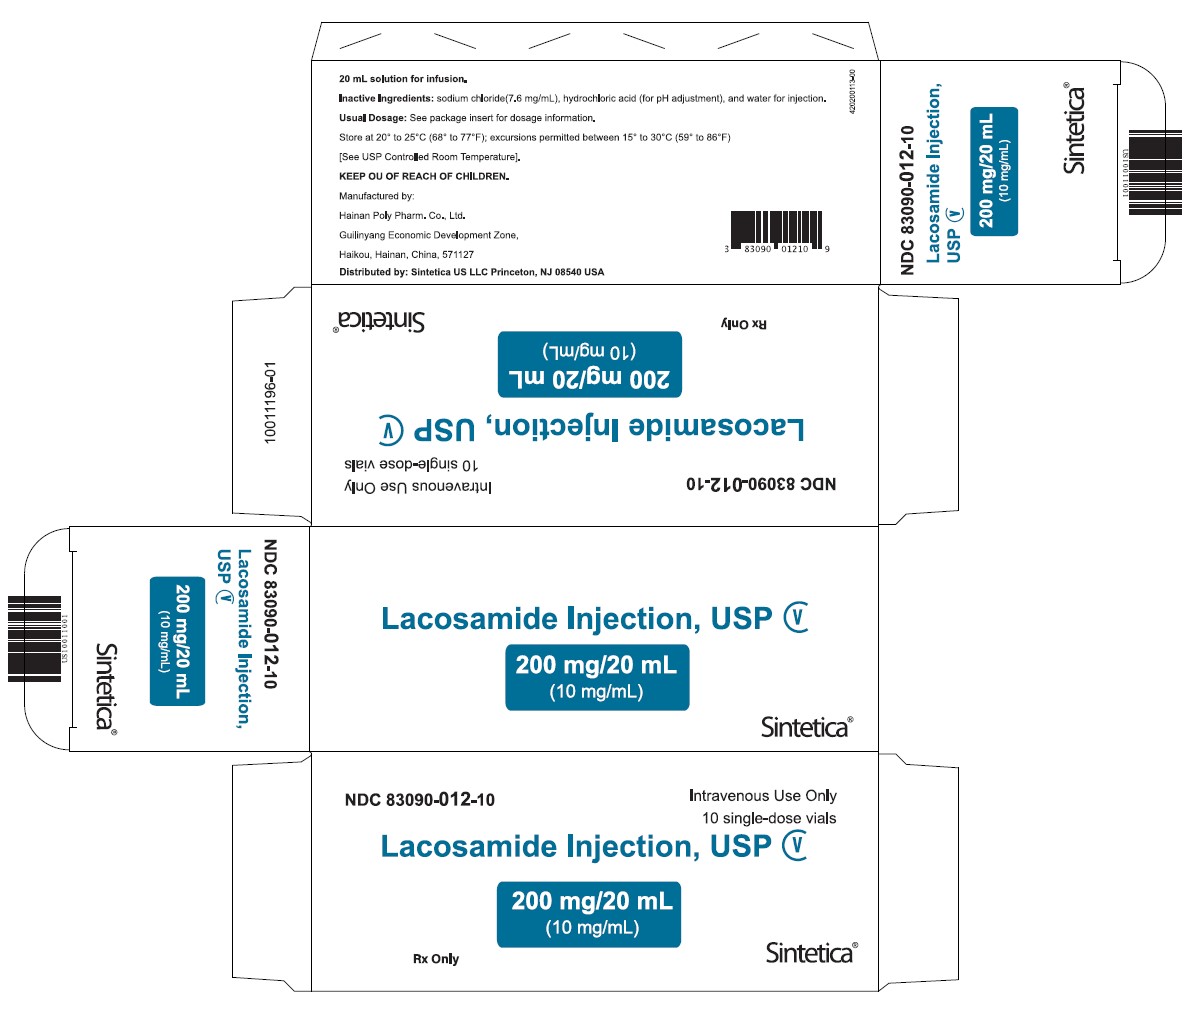
Principal Display Panel (20 mL vial carton)

Principal Display Panel (20 mL vial carton)
Packaging label for Lacosamide Injection, USP 200 mg/20 mL (10 mg/mL) intravenous injection. The label indicates the product is distributed by Sintetica US LLC and includes 10 single-dose vials. It provides storage instructions and lists inactive ingredients such as sodium chloride and hydrochloric acid. The label features barcodes and the NDC 83090-012-10.*
FDA Label Image

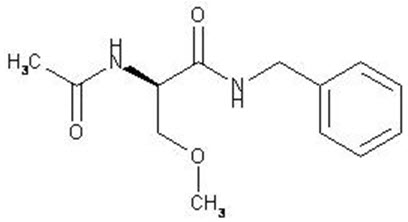
Chemical Structure (Lacosamideinjection 011)

Chemical Structure (Lacosamideinjection 011)
Chemical structure diagram of lacosamide, showing its molecular arrangement with labeled functional groups and bonds.*
FDA Label Image

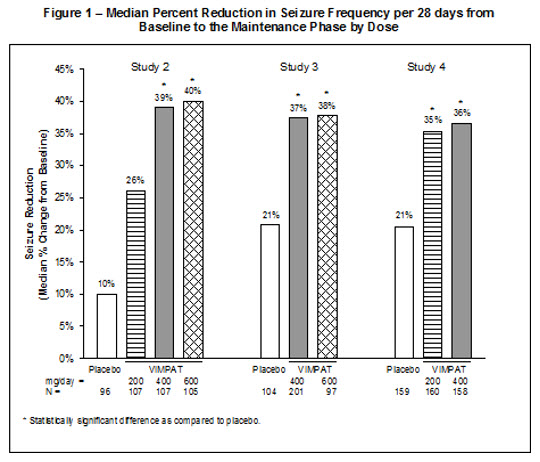
Figure 1 (Lacosamideinjection 012)

Figure 1 (Lacosamideinjection 012)
A bar chart titled 'Median Percent Reduction in Seizure Frequency per 28 days from Baseline to the Maintenance Phase by Dose' comparing seizure frequency reduction in three studies (Study 2, Study 3, Study 4) between placebo and various doses of VIMPAT (lacosamide). The y-axis shows seizure reduction percentage from 0% to 45%, and the x-axis lists dose groups with sample sizes. VIMPAT doses show higher median seizure reductions than placebo across all studies, with statistical significance indicated in some comparisons.*
FDA Label Image

Figure 2 (Lacosamideinjection 013)

Figure 2 (Lacosamideinjection 013)
A line graph titled "Proportion of Patients by Responder Rate for VIMPAT and Placebo Groups in Studies 2, 3, and 4." The x-axis represents percent of patients from 100% to 0%, and the y-axis shows responder rate from -100% (worsening) to 100% (improvement). It compares responder rates for Placebo and three VIMPAT dosing groups (200 mg/day, 400 mg/day, 600 mg/day) with corresponding sample sizes indicated in the legend.*

* About these descriptions: Image descriptions on this page are generated by automated AI analysis of the product label images from the manufacturer's FDA label submission (SPL). They are provided for reference only and may contain errors or omissions. Always rely on the printed label itself and the official FDA labeling, and consult a pharmacist or healthcare professional with any questions about this product.