Gabapentin Capsule
Product Images NDC 83209-663

View Photos of Packaging, Regulatory Labels, and Product Appearance

Product Visual Gallery

This gallery contains 7 technical images submitted to the FDA as part of the official labeling for Gabapentin (NDC 83209-663). Unlike standard consumer photos, these assets often include clinical data figures, molecular chemical structures, and official manufacturer packaging layouts.

As provided by Boswell Pharmacy Services Llc D/b/a Bps Wholesale, these visuals offer a comprehensive scientific overview of the product's physical and chemical identity, aiding pharmacists and researchers in product verification and study.

FDA Label Image

Gabapentin 400mg -30 (Gabapentin 400mg 16714 0663 02 30)

Gabapentin 400mg -30 (Gabapentin 400mg 16714 0663 02   30)
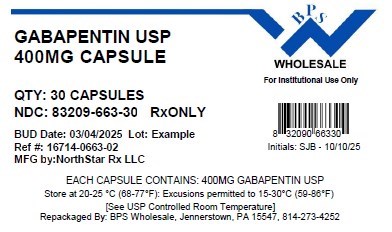
This is a description of Gabapentin USP 400mg capsules available for wholesale purchase. The capsules come in a pack of 30 and are manufactured by NorthStar Rx LLC. Each capsule contains 400mg of Gabapentin USP. The expiration date is 03/10/2025 with lot number Example: "unvn“nu]zq". The capsules should be stored at controlled room temperature. Repackaged by 575 Wholesale in Jennerson, PA. Contact 8142734252 for more information.*
FDA Label Image

Equation Of Cockcroft And Gault (Gabapentin Fig1)

Equation Of Cockcroft And Gault (Gabapentin Fig1)
This text appears to be a formula for calculating creatinine clearance (Lr) based on age, weight, and gender. The formula multiplies age in years by weight in kilograms, and the result is divided by 4. For female patients, the creatinine clearance value should be multiplied by 0.85.*
FDA Label Image

Fig-2 (Gabapentin Fig2)

Fig-2 (Gabapentin Fig2)
This text appears to contain information related to a pain study involving different treatment groups and dose schedules. It mentions baseline data and 4-week fixed dose periods for placebo and Gabapentin at 3600 mg/day. The text seems to show a grid or table displaying mean pain scores across different time points.*
FDA Label Image

Fig-3 (Gabapentin Fig3)

Fig-3 (Gabapentin Fig3)
This appears to be a chart showing different dose levels of a medication (placebo, Gatspntin 1600y, and Gaagentn 2400 sy) and their effects on the mean pain score over certain periods (Baseline, 1, 2, 3, etc.). The information seems to pertain to a study or trial evaluating the efficacy of the different doses on pain management.*
FDA Label Image

Figure 3. Proportion Of Responders (patients With ≥50% Reduction In Pain Score) At Endpoint: Controlled Phn Studies (Gabapentin Fig4)

Figure 3. Proportion Of Responders (patients With ≥50% Reduction In Pain Score) At Endpoint: Controlled Phn Studies (Gabapentin Fig4)
This text provides a figure showing the Proportion of Responders (patients with >50% reduction in pain score) at Endpoint in Controlled PHN Studies. The graph includes data for two studies, Study 1 and Study 2, comparing the effectiveness of two different treatments (PBO, GBP 3600, GBP 1800, GBP 2400) in reducing pain score in patients with postherpetic neuralgia (PHN). Study 1 showed 32% responders for one treatment and 29% for the other, while Study 2 showed 14% responders for one treatment.*
FDA Label Image

Figure 4. Responder Rate In Patients Receiving Gabapentin Expressed As A Difference From Placebo By Dose And Study: Adjunctive Therapy Studies In Patients ≥12 Years Of Age With Partial Seizures (Gabapentin Fig5)

FDA Label Image

Chemical Structure (Gabapentin Str)

* These product label images have been analyzed using experimental machine learning. Please verify findings with the primary label text.