Ogivri Kit
Product Images NDC 83257-004

View Photos of Packaging, Regulatory Labels, and Product Appearance

Product Visual Gallery

This gallery contains 10 technical images submitted to the FDA as part of the official labeling for Ogivri (NDC 83257-004). Unlike standard consumer photos, these assets often include clinical data figures, molecular chemical structures, and official manufacturer packaging layouts.

As provided by Biocon Biologics Inc., these visuals offer a comprehensive scientific overview of the product's physical and chemical identity, aiding pharmacists and researchers in product verification and study.

FDA Label Image

Figure 10 Ogivri For Injection 150 mg/vial Carton Label (Image 10)

Figure 10 Ogivri For Injection 150 mg/vial Carton Label (Image 10)
Packaging label for Ogivri (trastuzumab-dkst) Injection, 150 mg/vial. The label indicates it is for intravenous infusion after reconstitution, contains no preservative, and should be kept refrigerated. It is a single-dose vial, with instructions to discard unused portions. The labeler is Biocon Biologics Inc., and the label includes lot and expiry information areas, barcode, and storage instructions.*
FDA Label Image

Figure 8 Ogivri For Injection 420 mgvial Carton Label With Diluent (Image 8)

Figure 8 Ogivri For Injection 420 mgvial Carton Label With Diluent (Image 8)
Packaging label for Ogivri (trastuzumab-dkst) injection, lyophilized powder for solution in a vial, 420 mg per vial strength. The label indicates it is a multiple-dose vial for intravenous infusion, requiring reconstitution. The labeler is Biocon Biologics Inc., and the product is prescription-only (Rx only). The design includes branding, usage instructions, and a barcode.*
FDA Label Image

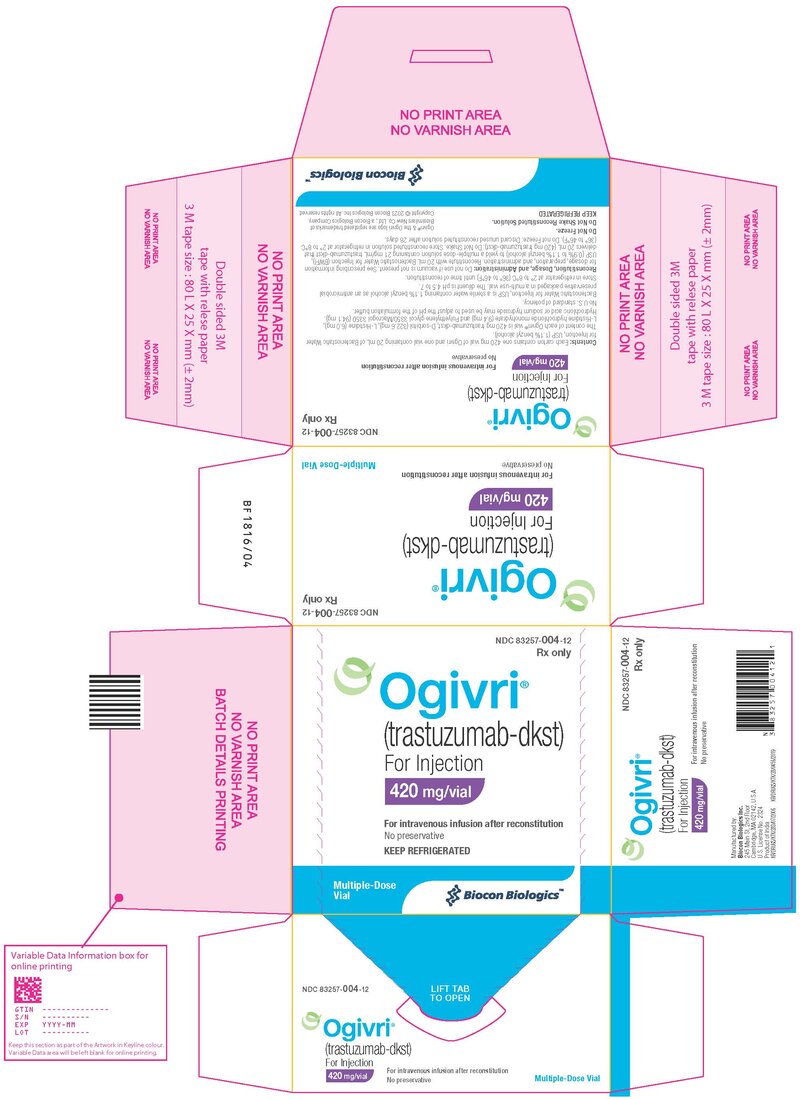
Figure 9 Ogivri For Injection 420 mg/vial Carton Label (Image 9)

Figure 9 Ogivri For Injection 420 mg/vial Carton Label (Image 9)
Packaging label for Ogivri (trastuzumab-dkst) injection, powder, lyophilized for solution, 420 mg per vial. The label shows the product as a multiple-dose vial for intravenous infusion after reconstitution. The manufacturer is Biocon Biologics Inc. The label includes storage instructions to keep refrigerated and specifies no preservative.*
FDA Label Image

Figure 1 Studies 1 And 2: Cumulative Incidence Of Time To First Lvef (Image 01)

Figure 1 Studies 1 And 2: Cumulative Incidence Of Time To First Lvef (Image 01)
A cumulative incidence graph titled 'Studies 1 and 2: Cumulative Incidence of Time to First LVEF Decline of ≥10 Percentage Points from Baseline and to Below 50% with Death as a Competing Risk Event.' The x-axis represents time in years from initiation of Paclitaxel/Trastuzumab treatment, ranging from 0 to 8 years. The y-axis shows cumulative incidence values from 0.00 to 0.50. Two lines compare treatment groups AC -> T and AC -> T+H over time. The chart includes risk numbers at specific time points below the x-axis.*
FDA Label Image

Figure 2 Study 3: Cumulative Incidence Of Time To First Lvef Decline Of ≥ 10 Percentage Points From Baseline And To Below 50% With Death As A Competing Risk Event (Image 02)

Figure 2 Study 3: Cumulative Incidence Of Time To First Lvef Decline Of ≥ 10 Percentage Points From Baseline And To Below 50% With Death As A Competing Risk Event (Image 02)
A line graph titled 'Study 3: Cumulative Incidence of Time to First LVEF Decline of ≥ 10 Percentage Points from Baseline and to Below 50% with Death as a Competing Risk Event.' The graph shows cumulative incidence on the vertical axis and time from randomization in months on the horizontal axis up to 24 months. Two lines represent 'Observation Only' (dashed line) and 'Trastuzumab 1-Year' (solid line). The graph includes numbers at risk at various time points below the x-axis.*
FDA Label Image

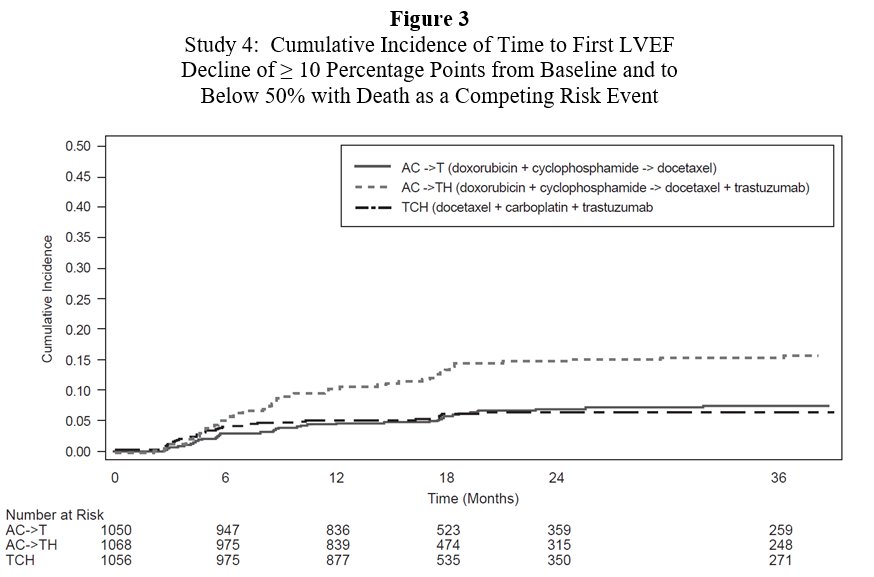
Figure 3 Study 4: Cumulative Incidence Of Time To First Lvef Decline Of ≥ 10 Percentage Points From Baseline And To Below 50% With Death As A Competing Risk Event (Image 03)

Figure 3 Study 4: Cumulative Incidence Of Time To First Lvef Decline Of ≥ 10 Percentage Points From Baseline And To Below 50% With Death As A Competing Risk Event (Image 03)
A line graph titled 'Cumulative Incidence of Time to First LVEF Decline of ≥ 10 Percentage Points from Baseline and to Below 50% with Death as a Competing Risk Event'. The y-axis shows cumulative incidence from 0 to 0.50, and the x-axis shows time in months from 0 to 36. Three lines represent different treatment groups: AC ->T (doxorubicin + cyclophosphamide followed by docetaxel), AC ->TH (doxorubicin + cyclophosphamide followed by docetaxel + trastuzumab), and TCH (docetaxel + carboplatin + trastuzumab). The AC ->TH line shows higher cumulative incidence over time. Below the graph, the number of patients at risk at various time points is listed for each group.*
FDA Label Image

Figure 4 Duration Of Disease-free Survival In Patients With Adjuvant Treatment Of Breast Cancer (studies 1 And 2) (Image 04)

Figure 4 Duration Of Disease-free Survival In Patients With Adjuvant Treatment Of Breast Cancer (studies 1 And 2) (Image 04)
A line graph titled 'Duration of Disease-Free Survival in Patients with Adjuvant Treatment of Breast Cancer (Studies 1 and 2)'. The x-axis represents disease-free survival in years (0 to 3.5 years), and the y-axis shows the proportion event-free (0.0 to 1.0). Two survival curves are shown: a dashed line for AC -> TH (doxorubicin + cyclophosphamide -> paclitaxel + trastuzumab) and a solid line for AC -> T (doxorubicin + cyclophosphamide -> paclitaxel). The graph includes the number of patients at risk at various time points for both groups.*
FDA Label Image

Figure 5 Duration Of Overall Survival In Patients With Adjuvant Treatment Of Breast Cancer (studies 1 And 2) (Image 05)

Figure 5 Duration Of Overall Survival In Patients With Adjuvant Treatment Of Breast Cancer (studies 1 And 2) (Image 05)
A Kaplan-Meier curve showing the duration of overall survival in patients with adjuvant treatment of breast cancer from two studies. The graph compares two treatment groups: AC->T (doxorubicin + cyclophosphamide -> paclitaxel) versus AC->T+H (doxorubicin + cyclophosphamide -> paclitaxel + trastuzumab). The y-axis represents the proportion of patients alive, and the x-axis shows overall survival in years over a period of up to 11 years. The AC->T+H group shows higher survival proportions compared to AC->T alone.*
FDA Label Image

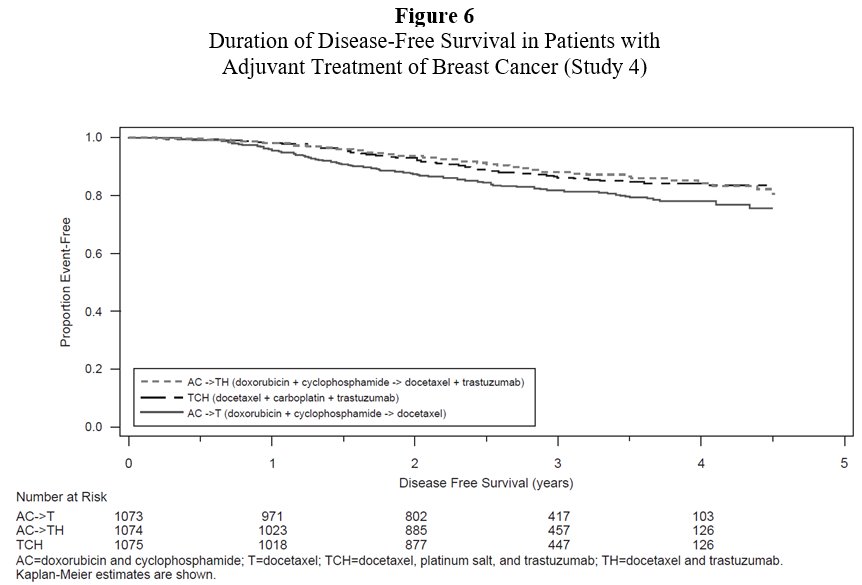
Figure 6 Duration Of Disease-free Survival In Patients With Adjuvant Treatment Of Breast Cancer (study 4) (Image 06)

Figure 6 Duration Of Disease-free Survival In Patients With Adjuvant Treatment Of Breast Cancer (study 4) (Image 06)
A Kaplan-Meier survival curve graph depicting Duration of Disease-Free Survival in patients with adjuvant treatment of breast cancer (Study 4). The x-axis represents Disease Free Survival in years (0 to 5), and the y-axis indicates the Proportion Event-Free (0 to 1). Three treatment regimens with respective curves are shown: AC->TH, TCH, and AC->T, with number at risk data presented below.*
FDA Label Image

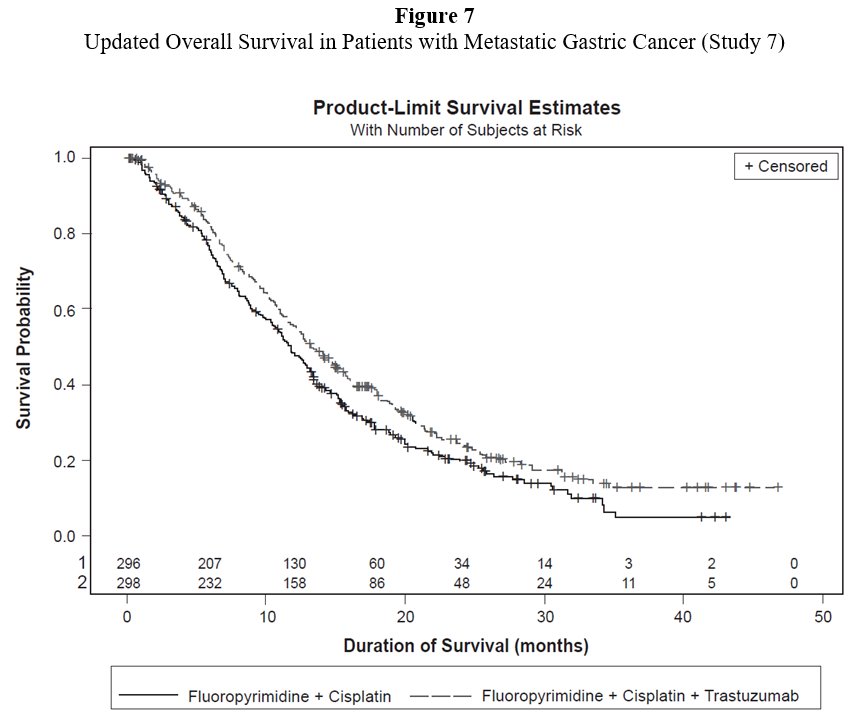
Figure 7 Updated Overall Survival In Patients With Metastatic Gastric Cancer (study 7) (Image 07)

Figure 7 Updated Overall Survival In Patients With Metastatic Gastric Cancer (study 7) (Image 07)
A Kaplan-Meier survival curve graph titled 'Updated Overall Survival in Patients with Metastatic Gastric Cancer (Study 7).' It shows product-limit survival estimates with survival probability on the vertical axis and duration of survival in months on the horizontal axis. Two curves represent treatment groups: Fluoropyrimidine + Cisplatin, and Fluoropyrimidine + Cisplatin + Trastuzumab. The graph includes censored data points and numbers of subjects at risk at various time points.*

* About these descriptions: Image descriptions on this page are generated by automated AI analysis of the product label images from the manufacturer's FDA label submission (SPL). They are provided for reference only and may contain errors or omissions. Always rely on the printed label itself and the official FDA labeling, and consult a pharmacist or healthcare professional with any questions about this product.