Yesafili Injection, Solution
Product Images NDC 83257-035

View Photos of Packaging, Regulatory Labels, and Product Appearance

Product Visual Gallery

This gallery contains 20 technical images submitted to the FDA as part of the official labeling for Yesafili (NDC 83257-035). Unlike standard consumer photos, these assets often include clinical data figures, molecular chemical structures, and official manufacturer packaging layouts.

As provided by Biocon Biologics Inc., these visuals offer a comprehensive scientific overview of the product's physical and chemical identity, aiding pharmacists and researchers in product verification and study.

FDA Label Image

Figure-a (Figure A)

Figure-a (Figure A)
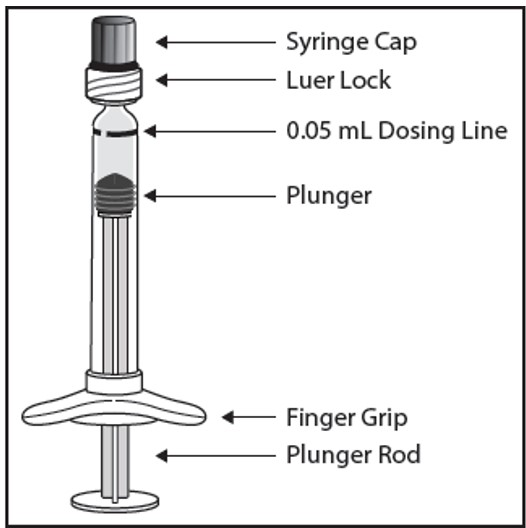
An instructional diagram of a syringe for intravitreal injection, labeled with parts including the syringe cap, luer lock, 0.05 mL dosing line, plunger, finger grip, and plunger rod. The syringe is intended for administration of YESAFILI (aflibercept-jbvf) 2 mg/0.05 mL injection solution.*
FDA Label Image

Figure-b (Figure B)

Figure-b (Figure B)
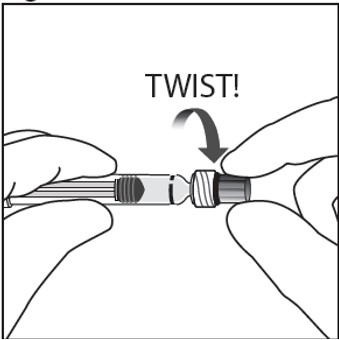
An instructional illustration showing hands holding a syringe-like device with an arrow indicating the action to twist the cap or part of the device. The text 'TWIST!' is shown above the arrow, guiding the user on how to operate the device.*
FDA Label Image

Figure-c (Figure C)

Figure-c (Figure C)
An instructional illustration showing hands removing a cap from the tip of a prefilled syringe filled with liquid. The image demonstrates the proper way to detach the syringe cap before injection use.*
FDA Label Image

Figure-d (Figure D)

Figure-d (Figure D)
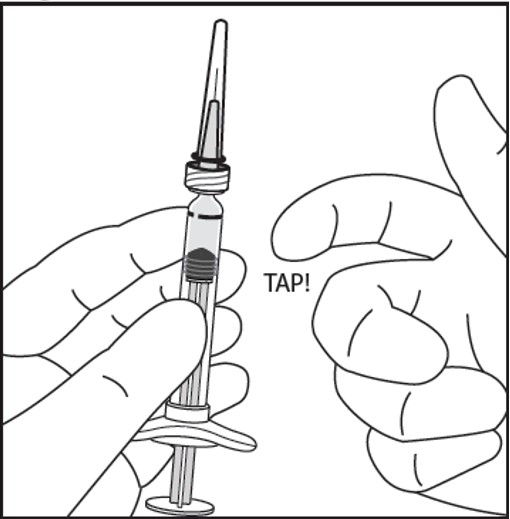
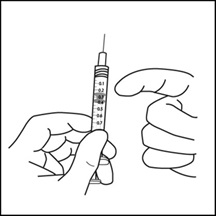
An instructional illustration showing two hands holding a syringe. One hand holds the syringe while the other hand is positioned to gently tap the syringe barrel, indicating a step in preparation or administration technique.*
FDA Label Image

Figure-e (Figure E)

Figure-e (Figure E)
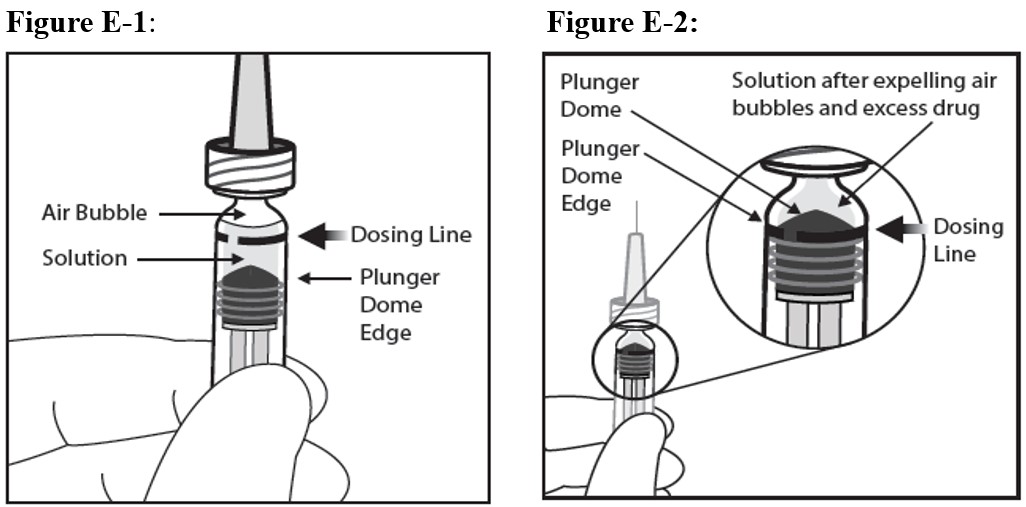
Illustrations showing proper preparation of the YESAFILI (aflibercept-jbvf) 2 mg/.05 mL injection. Figure E-1 labels the syringe components including air bubble, solution, dosing line, and plunger dome edge. Figure E-2 shows the solution after expelling air bubbles and excess drug, focusing on correct positioning relative to the dosing line and plunger dome.*
FDA Label Image

Figure-f (Figure F)

Figure-f (Figure F)
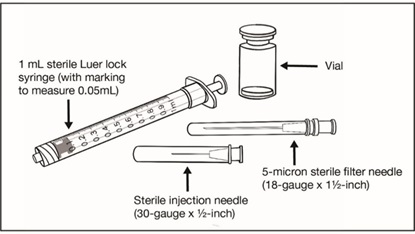
An instructional diagram showing a 1 mL sterile Luer lock syringe marked to measure 0.05 mL, a vial, a 5-micron sterile filter needle (18-gauge, 1½-inch), and a sterile injection needle (30-gauge, ½-inch), illustrating components used for an injection procedure.*
FDA Label Image

Figure-h (Figure H)

Figure-h (Figure H)
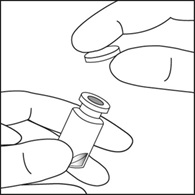
An instructional black-and-white line drawing showing one hand holding a small vial and the other hand removing or placing a rubber stopper on the vial's opening. This image likely demonstrates proper handling or preparation of an injection solution for intravitreal use.*
FDA Label Image

Figure-i (Figure I)

Figure-i (Figure I)
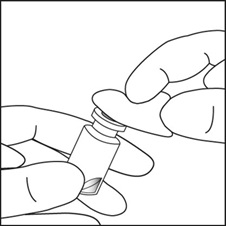
An instructional illustration showing hands removing or placing a cap on the top of a small vial, likely related to preparing a dose for injection. The vial is upright and is being held steady while the cap is manipulated by the other hand.*
FDA Label Image

Figure-j (Figure J)

Figure-j (Figure J)
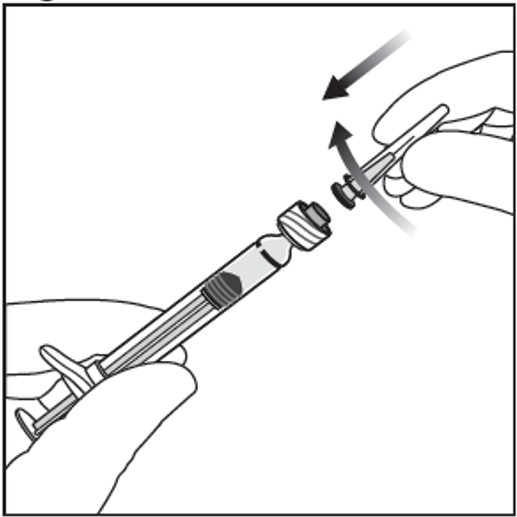
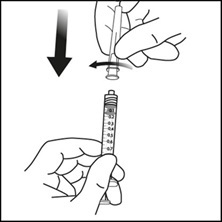
Illustration showing a hand holding a syringe with measurement markings while another hand removes or attaches a protective cap or cover from the syringe, indicated by a downward arrow. This is related to preparation or administration of an intravitreal injection.*
FDA Label Image

Figure-l (Figure L)

Figure-l (Figure L)
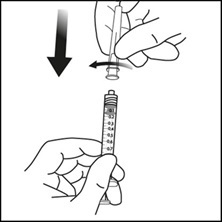
An instructional illustration showing hands preparing a syringe. One hand holds the syringe with measurement markings, and the other hand is positioned above, pressing down on the plunger or cap, indicated by a downward arrow. This image likely depicts a step in the preparation or administration process of an injectable solution.*
FDA Label Image

Figure M (Figure M)

Figure M (Figure M)
An instructional illustration depicting hands preparing a syringe, which is likely related to the administration of YESAFILI (aflibercept-jbvf) injection, solution, intravitreal. One hand holds the syringe while the other hand is positioned nearby, illustrating the proper handling technique.*
FDA Label Image

Figure O (Figure O)

Figure O (Figure O)
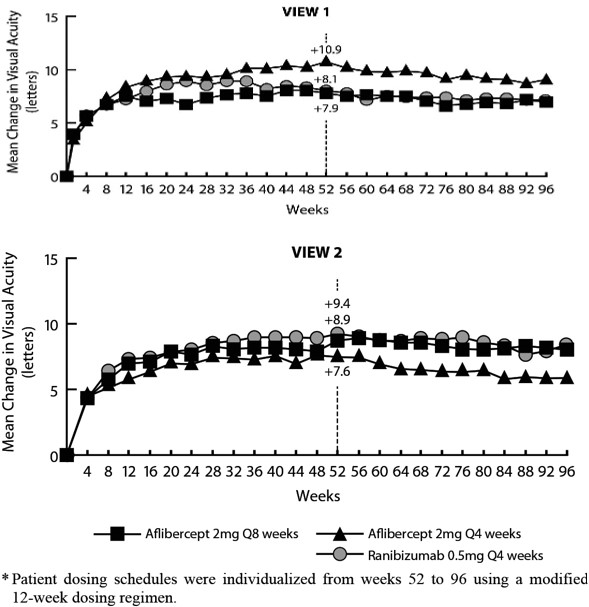
Two line graphs depicting mean change in visual acuity (letters) over 96 weeks for different dosing regimens. The top graph (VIEW 1) compares Aflibercept 2 mg every 8 weeks, Aflibercept 2 mg every 4 weeks, and Ranibizumab 0.5 mg every 4 weeks, showing changes over time with noted values around week 48-52. The bottom graph (VIEW 2) shows a similar comparison, with individual dosing adjustments from week 52 to 96. The x-axis represents weeks, and the y-axis represents mean change in visual acuity letters.*
FDA Label Image

Figure P (Figure P)

Figure P (Figure P)
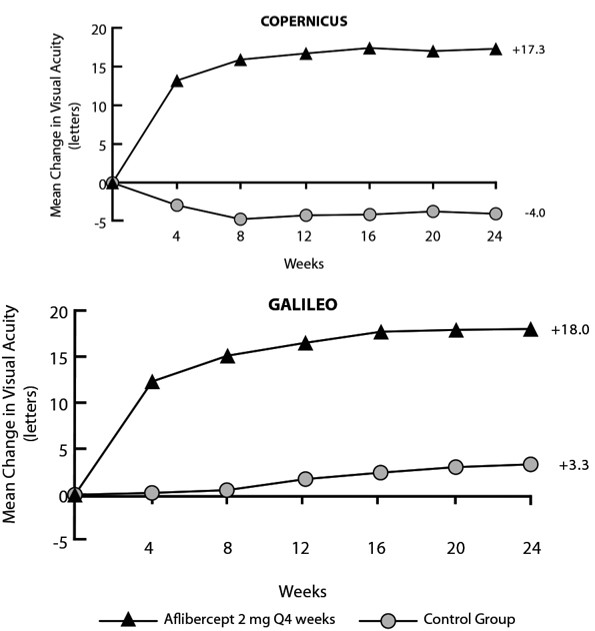
This image contains two line graphs showing mean change in visual acuity (letters) over 24 weeks for the COPERNICUS and GALILEO studies. Both graphs compare aflibercept 2 mg administered every 4 weeks (represented by triangles) against a control group (represented by circles). The aflibercept groups demonstrate a sustained increase in visual acuity, while control groups show minimal or negative changes over time.*
FDA Label Image

Figure Q (Figure Q)

Figure Q (Figure Q)
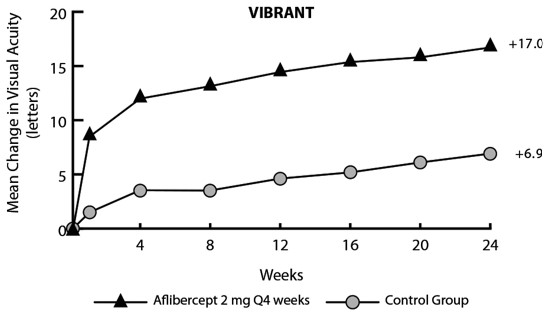
This line graph titled 'VIBRANT' shows mean change in visual acuity (letters) over 24 weeks. Two groups are compared: one receiving Aflibercept 2 mg every 4 weeks, showing an increase in letters read up to about 17, and a control group showing a smaller increase, approximately 7 letters. Data points are marked with triangles for Aflibercept and circles for control.*
FDA Label Image

Figure R (Figure R)

Figure R (Figure R)
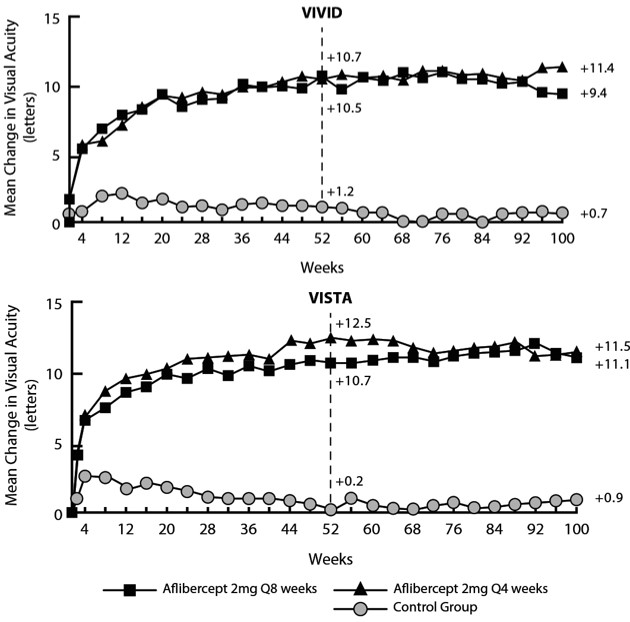
Two line graphs labeled VIVID and VISTA showing mean change in visual acuity (letters) over 100 weeks. The graphs compare three groups: Aflibercept 2 mg every 8 weeks, Aflibercept 2 mg every 4 weeks, and a control group, with mean letter improvements indicated at week 52 and week 100. The vertical axis represents mean change in visual acuity and the horizontal axis represents time in weeks.*
FDA Label Image

Figure-s (Figure S)

Figure-s (Figure S)
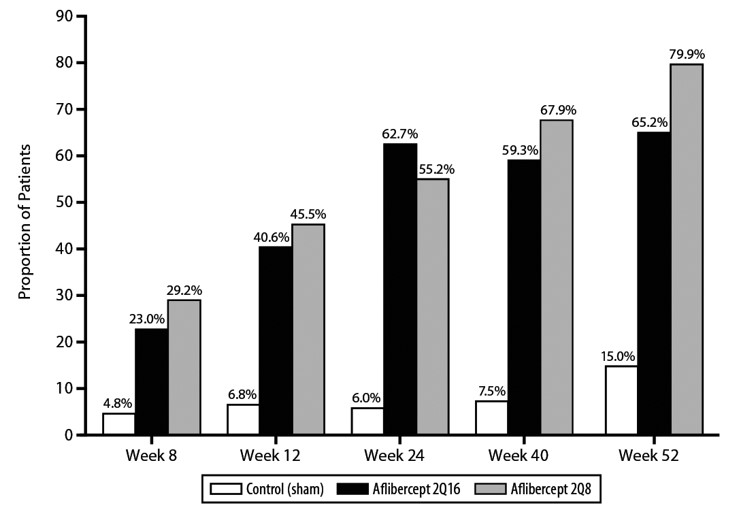
A bar graph showing the proportion of patients over five time points (Week 8, 12, 24, 40, 52) for three groups: Control (sham), Aflibercept 2Q16, and Aflibercept 2Q8. The graph compares patient response rates, with Aflibercept 2Q8 generally showing the highest proportions, followed by Aflibercept 2Q16, and Control (sham) the lowest.*
FDA Label Image

Image-04 (Image 04)

Image-04 (Image 04)
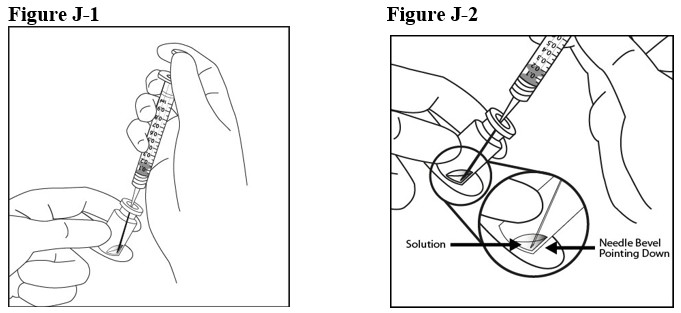
Illustrations showing preparation of an injection syringe. Figure J-1 depicts drawing solution into the syringe from a vial. Figure J-2 shows the syringe needle immersed in the solution with the needle bevel pointing down, emphasizing correct positioning for drawing the solution.*
FDA Label Image

Image-05 (Image 05)

Image-05 (Image 05)
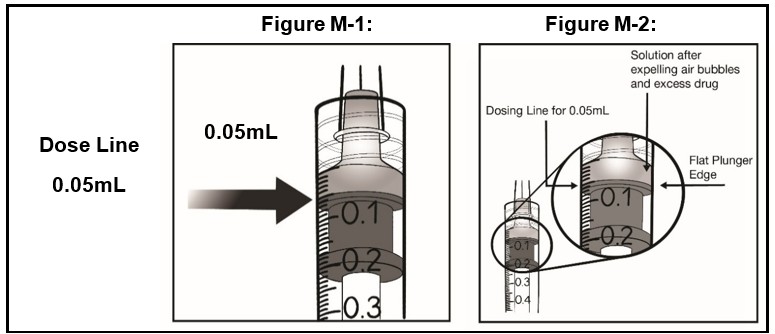
Illustration showing how to measure the 0.05 mL dose line on a syringe. Figure M-1 highlights the 0.05 mL dose line on the syringe barrel. Figure M-2 provides a close-up view illustrating the flat plunger edge aligned with the 0.05 mL dosing line after expelling air bubbles and excess drug solution.*
FDA Label Image

Image-06 (Image 06)

Image-06 (Image 06)
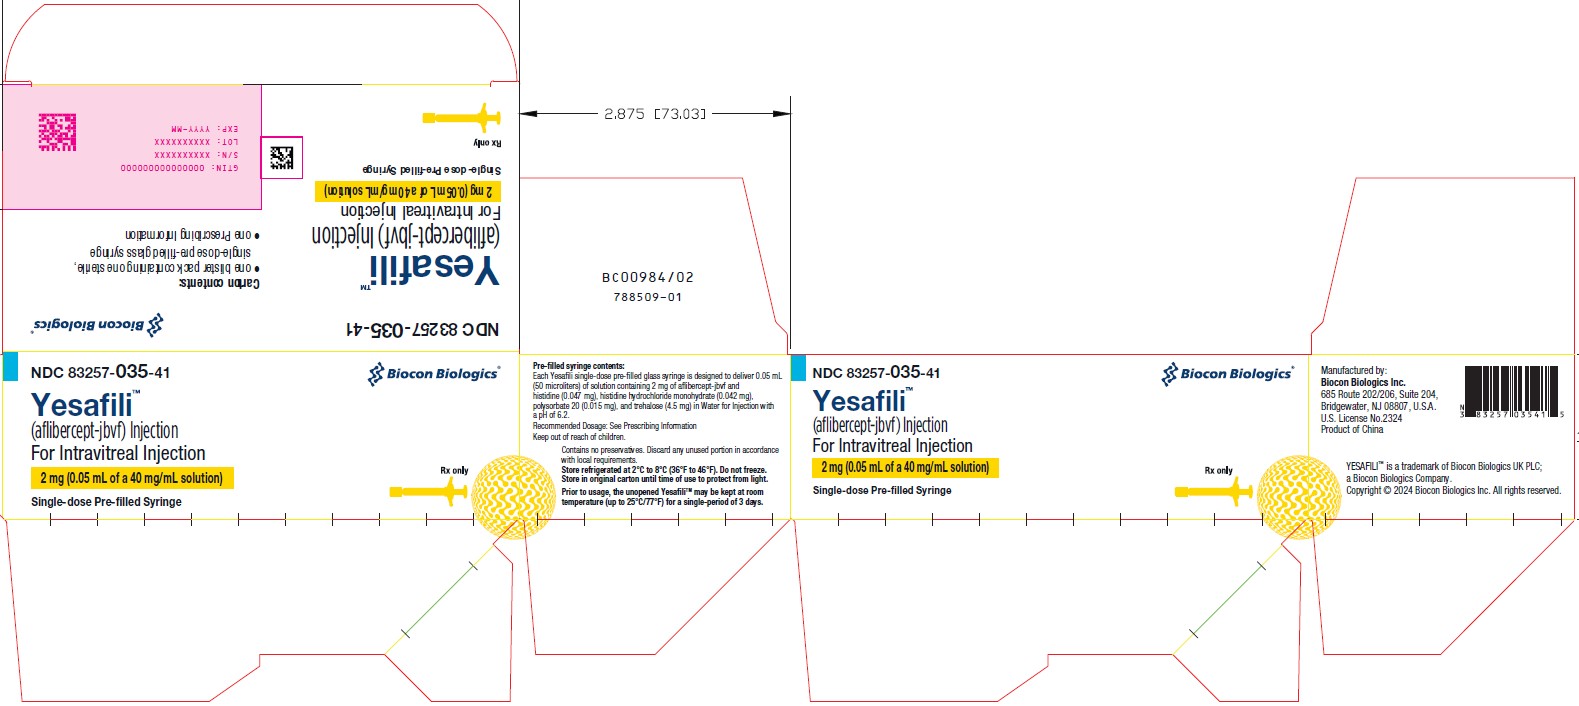
Packaging label for Yesafili (aflibercept-jbvf) Injection, Intravitreal Injection, 2 mg (0.05 mL of a 40 mg/mL solution). The label indicates a single-dose pre-filled syringe. Labeler is Biocon Biologics Inc. The label includes storage instructions, manufacturer address in Bridgewater, NJ, and usage information emphasizing prescription use only.*
FDA Label Image

* About these descriptions: Image descriptions on this page are generated by automated AI analysis of the product label images from the manufacturer's FDA label submission (SPL). They are provided for reference only and may contain errors or omissions. Always rely on the printed label itself and the official FDA labeling, and consult a pharmacist or healthcare professional with any questions about this product.