Sevoflurane, (volatile For Inhalation) Liquid
Product Images NDC 83301-0070

View Photos of Packaging, Regulatory Labels, and Product Appearance

Product Visual Gallery

This gallery contains 13 technical images submitted to the FDA as part of the official labeling for Sevoflurane, (volatile For Inhalation) (NDC 83301-0070). Unlike standard consumer photos, these assets often include clinical data figures, molecular chemical structures, and official manufacturer packaging layouts.

As provided by Mullan Pharmaceutical Inc., these visuals offer a comprehensive scientific overview of the product's physical and chemical identity, aiding pharmacists and researchers in product verification and study.

FDA Label Image

Chemical Structure (Sevoflurane 01)

Chemical Structure (Sevoflurane 01)
Chemical structure of Sevoflurane showing carbon, hydrogen, oxygen, and fluorine atoms with trifluoromethyl groups attached.*
FDA Label Image

Figure 1 (Sevoflurane 02)

Figure 1 (Sevoflurane 02)
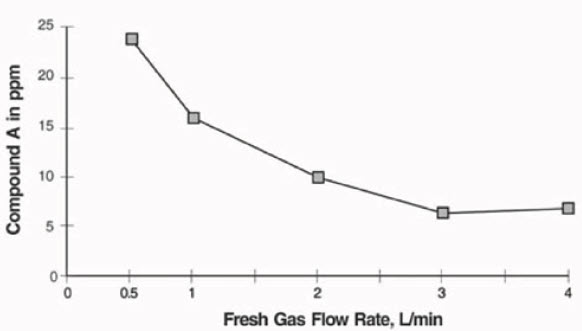
A line graph depicting the relationship between Fresh Gas Flow Rate (L/min) on the x-axis and Compound A concentration in ppm on the y-axis. The graph shows data points connected by a line, indicating how Compound A concentration decreases as the gas flow rate increases from 0.5 to 4 L/min.*
FDA Label Image

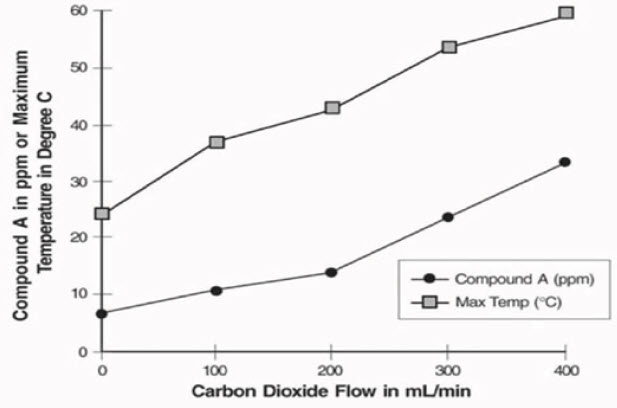
Figure 2 (Sevoflurane 03)

Figure 2 (Sevoflurane 03)
A line graph showing the relationship between carbon dioxide flow (mL/min) on the x-axis and compound A concentration (ppm) and maximum temperature (°C) on the y-axis. Two lines represent compound A levels and temperature changes as carbon dioxide flow increases, with compound A depicted by solid circles and maximum temperature by squares.*
FDA Label Image

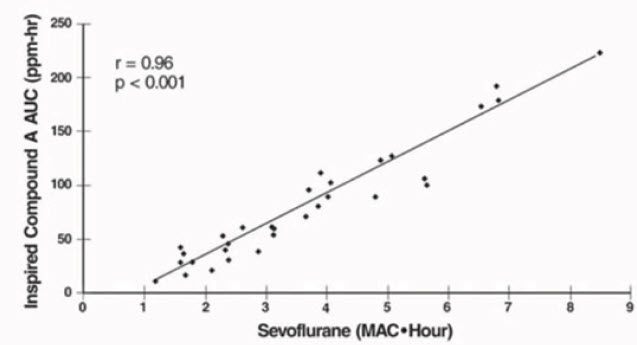
Figure 2a (Sevoflurane 04)

Figure 2a (Sevoflurane 04)
A scatter plot with a trend line illustrating the relationship between Sevoflurane exposure (MAC•Hour) on the x-axis and Inspired Compound A AUC (ppm•hr) on the y-axis. The graph shows a positive correlation with r = 0.96 and p < 0.001, indicating a strong statistical association between the two variables.*
FDA Label Image

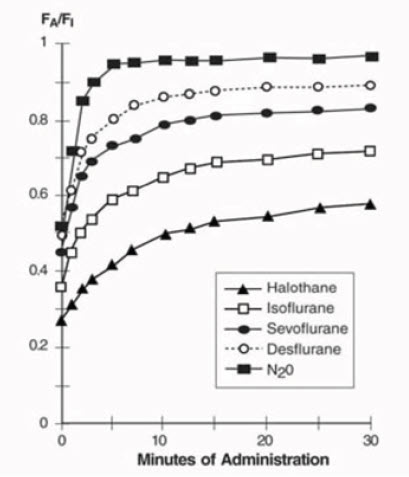
Figure 3 (Sevoflurane 05)

Figure 3 (Sevoflurane 05)
A line graph showing the uptake or concentration ratio (FA/FI) of different inhalation agents over time. The x-axis represents minutes of administration (0 to 30), and the y-axis represents the FA/FI ratio (0 to 1). The graph compares Halothane, Isoflurane, Sevoflurane, Desflurane, and N2O, illustrating their respective curves of uptake during inhalation administration.*
FDA Label Image

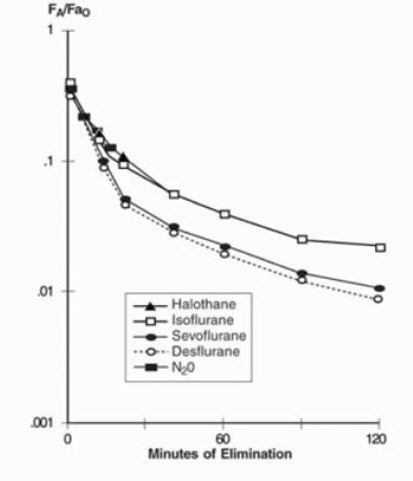
Figure 4 (Sevoflurane 06)

Figure 4 (Sevoflurane 06)
A line graph depicting the elimination over time of various inhaled anesthetic agents: Halothane, Isoflurane, Sevoflurane, Desflurane, and Nitrous Oxide (N2O). The x-axis shows minutes of elimination ranging from 0 to 120, and the y-axis shows the ratio FA/FAo on a logarithmic scale from 0.001 to 1.*
FDA Label Image

Figure 5 (Sevoflurane 07)

Figure 5 (Sevoflurane 07)
A line chart depicting serum fluoride levels (in micromolar, µM) measured over days post-anesthesia for different anesthetic agents: Methoxyflurane, Sevoflurane, Enflurane, Isoflurane, and Halothane. The x-axis shows days relative to anesthesia, and the y-axis shows serum fluoride concentration. Error bars indicate variability for each data point.*
FDA Label Image

Figure 6 (Sevoflurane 08)

Figure 6 (Sevoflurane 08)
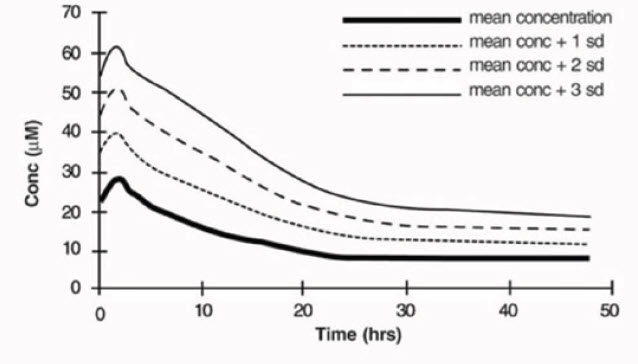
A line graph depicting the concentration (Conc) in micromolar (µM) of a substance over time in hours (hrs). Four lines are shown: mean concentration, mean concentration plus one standard deviation, mean concentration plus two standard deviations, and mean concentration plus three standard deviations, illustrating variability in concentration over a 48-hour period.*
FDA Label Image

Figure 7 (Sevoflurane 09)

Figure 7 (Sevoflurane 09)
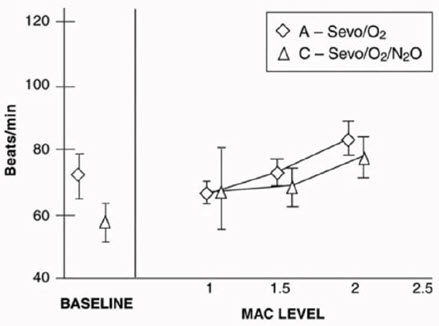
A line graph showing heart rate in beats per minute (y-axis) versus MAC level (x-axis) for Sevoflurane with two different gas mixtures: Sevo/O₂ and Sevo/O₂/N₂O. The graph includes baseline measurements and data points with error bars for MAC levels 1, 1.5, and 2.*
FDA Label Image

Figure 8 (Sevoflurane 10)

Figure 8 (Sevoflurane 10)
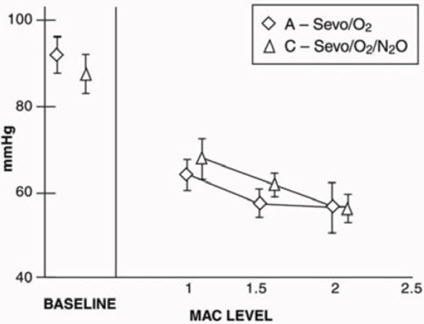
A line chart showing the relationship between MAC level (1 to 2.5) on the x-axis and mmHg values on the y-axis (ranging from 40 to 100). Two data series are plotted: one labeled A (Sevo/O2) represented by diamonds, and another labeled C (Sevo/O2/N2O) represented by triangles. Both series show a downward trend in mmHg values as MAC level increases.*
FDA Label Image

Figure 9 (Sevoflurane 11)

Figure 9 (Sevoflurane 11)
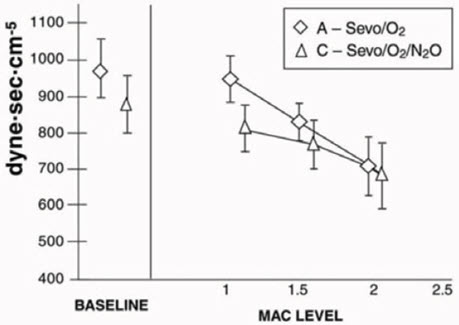
A line graph depicting the relationship between MAC (Minimum Alveolar Concentration) Level on the x-axis and viscosity (dyne·sec·cm⁻⁵) on the y-axis. Two data series, Sevo/O₂ and Sevo/O₂/N₂O, are shown with error bars indicating variability at different MAC levels from baseline through approximately 2.0.*
FDA Label Image

Figure 10 (Sevoflurane 12)

Figure 10 (Sevoflurane 12)
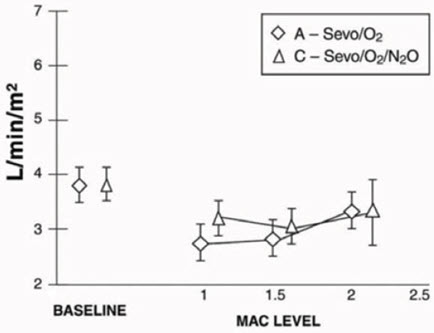
A line chart showing minute ventilation (L/min/m²) on the y-axis versus MAC level on the x-axis. Two data series are plotted: A – Sevo/O2 and C – Sevo/O2/N2O, with values around 3 to 4 L/min/m² across baseline and increasing MAC levels up to 2.5.*
FDA Label Image

Principal Display Panel (250 mL Bottle Carton)

Principal Display Panel (250 mL Bottle Carton)
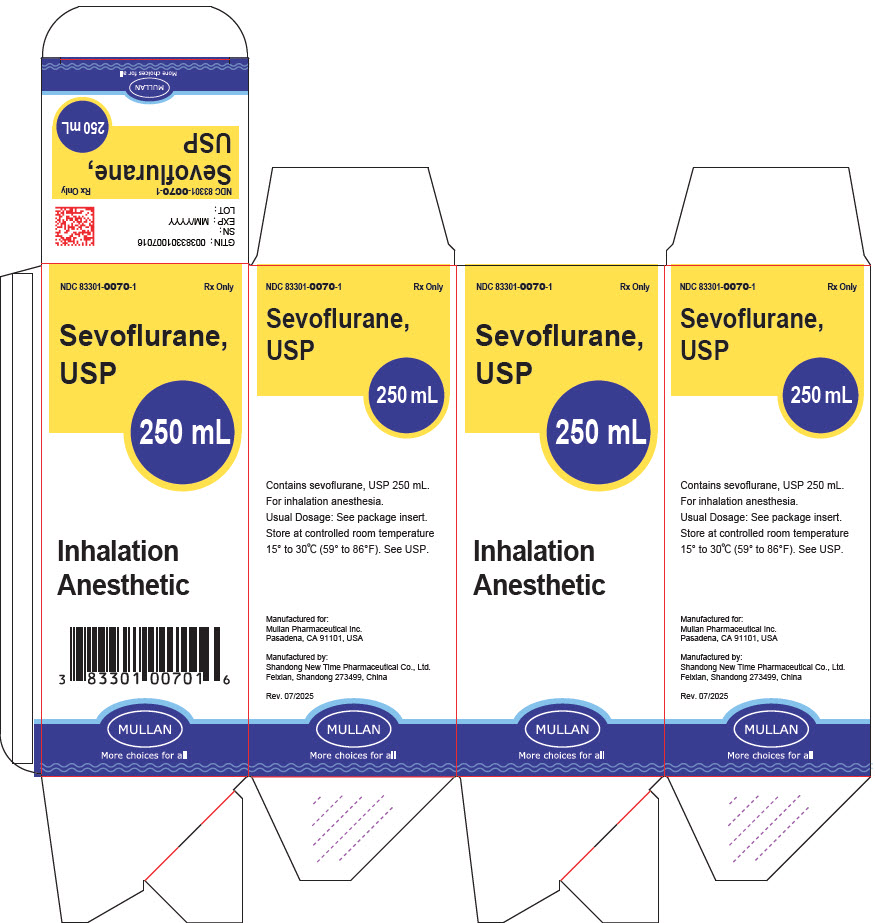
Packaging label for Sevoflurane, USP 250 mL liquid inhalation anesthetic by Mullan Pharmaceutical Inc. The label includes product strength (250 mL), method of administration (inhalation anesthetic), barcode, storage instructions, manufacturer details, and a blue-yellow color scheme with the Mullan logo and tagline.*

* About these descriptions: Image descriptions on this page are generated by automated AI analysis of the product label images from the manufacturer's FDA label submission (SPL). They are provided for reference only and may contain errors or omissions. Always rely on the printed label itself and the official FDA labeling, and consult a pharmacist or healthcare professional with any questions about this product.