Ryzumvi Solution/ Drops
Product Images NDC 83368-075

View Photos of Packaging, Regulatory Labels, and Product Appearance

Product Visual Gallery

This gallery contains 5 technical images submitted to the FDA as part of the official labeling for Ryzumvi (NDC 83368-075). Unlike standard consumer photos, these assets often include clinical data figures, molecular chemical structures, and official manufacturer packaging layouts.

As provided by Oyster Point Pharma, Inc., these visuals offer a comprehensive scientific overview of the product's physical and chemical identity, aiding pharmacists and researchers in product verification and study.

FDA Label Image

Ryzumvi Ophthalmic Solution 0.75% Carton Label (Image 01)

Ryzumvi Ophthalmic Solution 0.75% Carton Label (Image 01)
Packaging label for Ryzumvi (phentolamine ophthalmic solution) 0.75%, an ophthalmic solution for topical use in the eyes. The label states it is sterile and includes 6 pouches containing 5 single-patient-use vials each. The labeler is Oyster Point Pharma, Inc. The label design features green, blue, and white color blocks with the Rx only designation and a barcode.*
FDA Label Image

Phentolamine Mesylate Structural Formula (Image 02)

Phentolamine Mesylate Structural Formula (Image 02)
Chemical structure of phentolamine mesylate depicted as a molecular diagram showing the arrangement of atoms and bonds associated with this active pharmaceutical ingredient.*
FDA Label Image

Figure 1. Percentage Of Subjects With Study Eyes Returning To ≤0.2 Mm From Baseline Pupil Diameter By Time Point In The Mira-2 And Mira-3 Trials (Image 03)

Figure 1. Percentage Of Subjects With Study Eyes Returning To ≤0.2 Mm From Baseline Pupil Diameter By Time Point In The Mira-2 And Mira-3 Trials (Image 03)
Two bar graphs titled MIRA-2 and MIRA-3 display the percentage of subjects over time post treatment (hours) comparing placebo study eye, RYZUMVI study eye, and RYZUMVI fellow eye. Percentages are shown on the y-axis and time on the x-axis, illustrating treatment response rates with significant differences marked.*
FDA Label Image

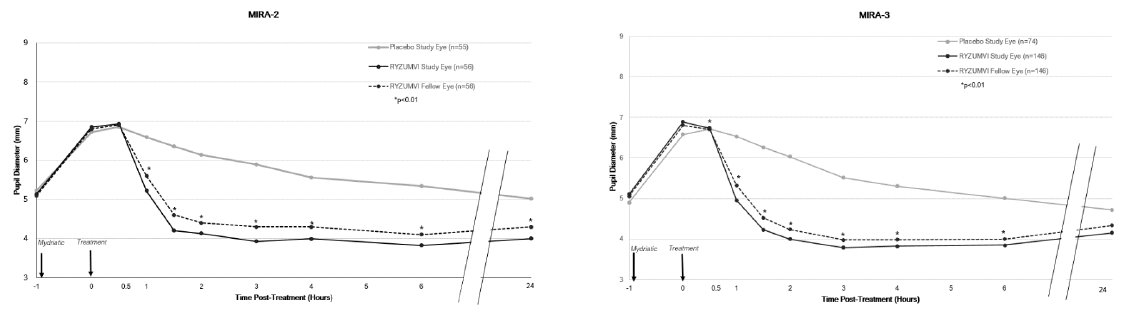
Figure 2: Pupil Dilation By Time Point With Phenylephrine As Mydriatic Agent In Mira-2 And Mira-3 Trials (mitt Population) (Image 04)

Figure 2: Pupil Dilation By Time Point With Phenylephrine As Mydriatic Agent In Mira-2 And Mira-3 Trials (mitt Population) (Image 04)
Two line graphs titled MIRA-2 and MIRA-3 showing pupil diameter (mm) over time post-treatment (hours). Data compare RYZUMVI study eyes and fellow eyes versus placebo study eyes, indicating changes in pupil diameter from baseline, with statistical significance marked at various points. The graphs include annotations for mydriatic and treatment times.*
FDA Label Image

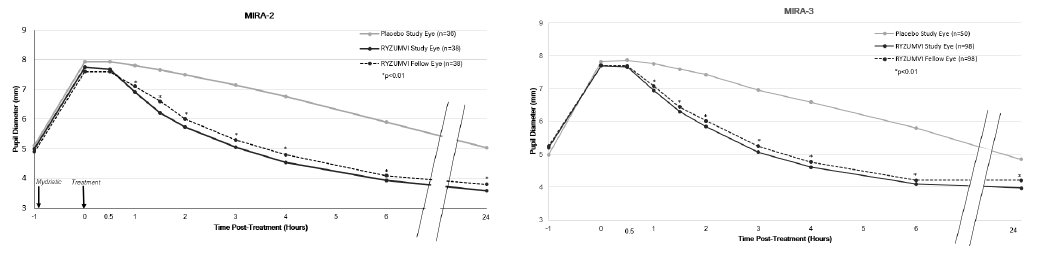
Figure 3: Pupil Dilation By Time Point With Tropicamide Or Paremyd As Mydriatic Agent In Mira-2 And Mira-3 Trials (mitt Population) (Image 05)

Figure 3: Pupil Dilation By Time Point With Tropicamide Or Paremyd As Mydriatic Agent In Mira-2 And Mira-3 Trials (mitt Population) (Image 05)
Two line graphs labeled MIRA-2 and MIRA-3 depicting pupil diameter (mm) over time post-treatment (hours). Each graph compares results for placebo study eyes versus Ryzumvi study and fellow eyes, with measurements taken from -1 to 24 hours. The graphs show trends in pupil diameter reduction following treatment.*

* About these descriptions: Image descriptions on this page are generated by automated AI analysis of the product label images from the manufacturer's FDA label submission (SPL). They are provided for reference only and may contain errors or omissions. Always rely on the printed label itself and the official FDA labeling, and consult a pharmacist or healthcare professional with any questions about this product.