Beizray Injection, Solution
Product Images NDC 83513-009

View Photos of Packaging, Regulatory Labels, and Product Appearance

Product Visual Gallery

This gallery contains 15 technical images submitted to the FDA as part of the official labeling for Beizray (NDC 83513-009). Unlike standard consumer photos, these assets often include clinical data figures, molecular chemical structures, and official manufacturer packaging layouts.

As provided by Zhuhai Beihai Biotech Co., Ltd., these visuals offer a comprehensive scientific overview of the product's physical and chemical identity, aiding pharmacists and researchers in product verification and study.

FDA Label Image

Albumin-final (Albumin Final)
Albumin-final (Albumin Final)
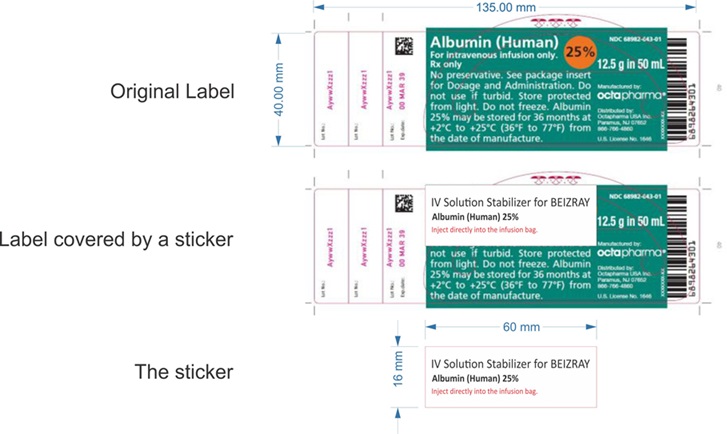
A packaging label showing an original label and a sticker label for Albumin (Human) 25% solution, 12.5 g in 50 mL. The original label includes storage and handling instructions, and the sticker indicates it is an IV solution stabilizer for BEIZRAY. The label features measurements and a barcode, with the manufacturer listed as Octapharma.*
FDA Label Image

Figure-1 (Figure 1)

Figure-1 (Figure 1)
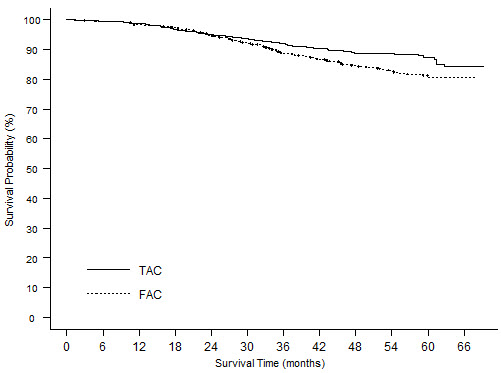
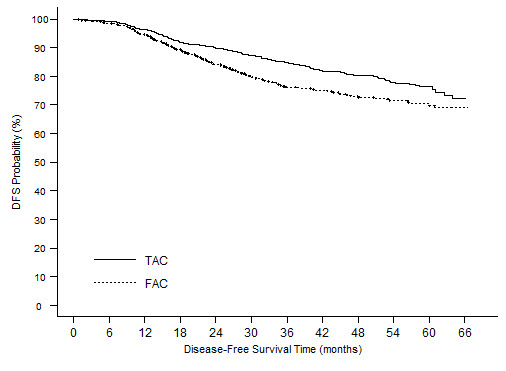
A line graph depicting disease-free survival (DFS) probability over time (months) for two treatment groups labeled TAC and FAC. The x-axis represents disease-free survival time in months up to 66 months, and the y-axis shows DFS probability percentages from 0% to 100%. Two lines compare survival probabilities, with TAC generally showing higher DFS than FAC over the observed period.*
FDA Label Image

Figure-10 (Figure 10)

Figure-10 (Figure 10)
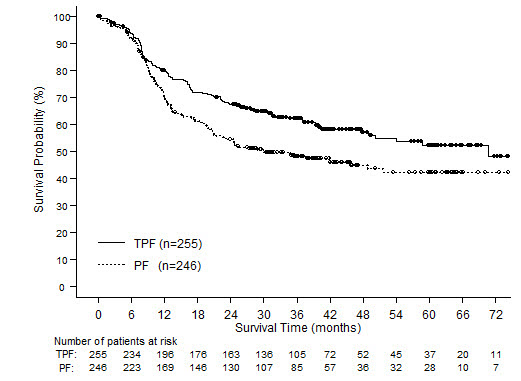
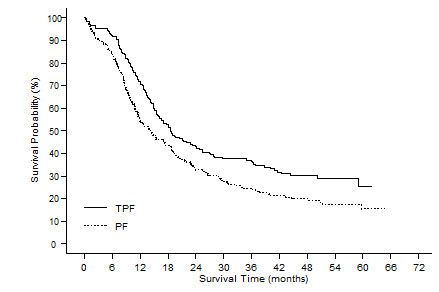
A survival curve graph showing survival probability (%) on the y-axis versus survival time in months on the x-axis. Two groups, labeled TPF (n=255) with a solid line, and PF (n=246) with a dotted line, are compared, with patient numbers at risk listed below the x-axis for various time points up to 72 months.*
FDA Label Image

Figure-2 (Figure 2)

Figure-2 (Figure 2)
A Kaplan-Meier survival curve graph showing survival probability (%) on the y-axis and survival time (months) on the x-axis. Two groups are compared: TAC (solid line) and FAC (dotted line), depicting their survival probabilities over time up to approximately 66 months.*
FDA Label Image

Figure-3 (Figure 3)

Figure-3 (Figure 3)
A Kaplan-Meier survival curve graph showing cumulative survival probability over time in months. It compares two groups labeled T75 (solid line) and BSC (dashed line), with T75 group demonstrating higher survival probability. The graph includes a log-rank test p-value of 0.010 for overall survival.*
FDA Label Image

Figure-4 (Figure 4)

Figure-4 (Figure 4)
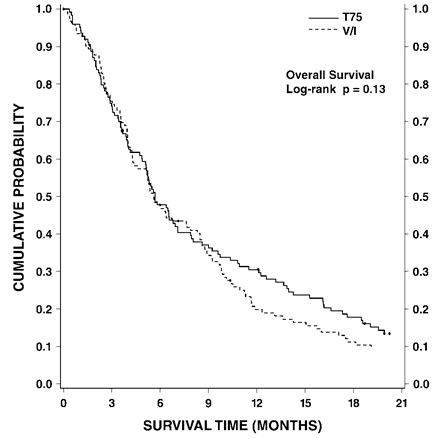
A survival curve chart comparing overall survival probabilities over time in months for two treatment groups labeled T75 and V/I. The plot shows cumulative probability on the y-axis and survival time in months on the x-axis, with a log-rank p-value of 0.13 indicated on the graph.*
FDA Label Image

Figure-5 (Figure 5)

Figure-5 (Figure 5)
A Kaplan-Meier survival curve graph showing survival probability over survival time in months up to 30 months. Two curves are displayed: a solid line labeled 'T75 q3w' and a dotted line labeled 'M q3w,' depicting comparative survival probabilities over time.*
FDA Label Image

Figure-6 (Figure 6)

Figure-6 (Figure 6)
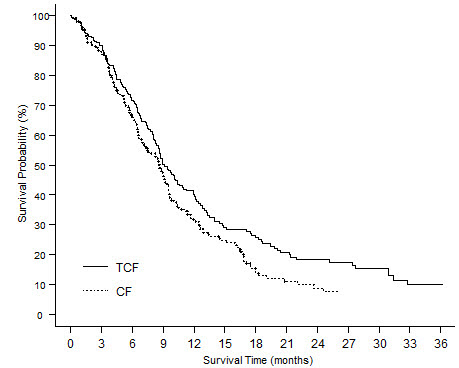
A Kaplan-Meier survival curve graph showing probability (%) on the y-axis and time in months on the x-axis. The graph compares two groups labeled TCF and CF, with TCF represented by a solid line and CF by a dotted line, illustrating survival probabilities over a 24-month period.*
FDA Label Image

Figure-7 (Figure 7)

Figure-7 (Figure 7)
A survival probability curve chart comparing two groups labeled TCF and CF. The x-axis represents survival time in months from 0 to 36, and the y-axis shows survival probability percentage ranging from 0 to 100%. The chart illustrates declining survival over time for both groups.*
FDA Label Image

Figure-8 (Figure 8)

Figure-8 (Figure 8)
A Kaplan-Meier survival curve chart depicting progression-free survival (PFS) probability (%) over time in months. The chart compares two treatment groups labeled TPF and PF, showing the decline in PFS probability over 42 months.*
FDA Label Image

Figure-9 (Figure 9)

Figure-9 (Figure 9)
A survival probability curve chart comparing two groups, labeled TPF and PF. The x-axis represents survival time in months, ranging from 0 to 72, and the y-axis shows survival probability in percentage, ranging from 0% to 100%. The chart depicts a higher survival probability over time for the TPF group compared to the PF group.*
FDA Label Image

Kit-label-9-27 (Kit Label 9 27)

Kit-label-9-27 (Kit Label 9 27)
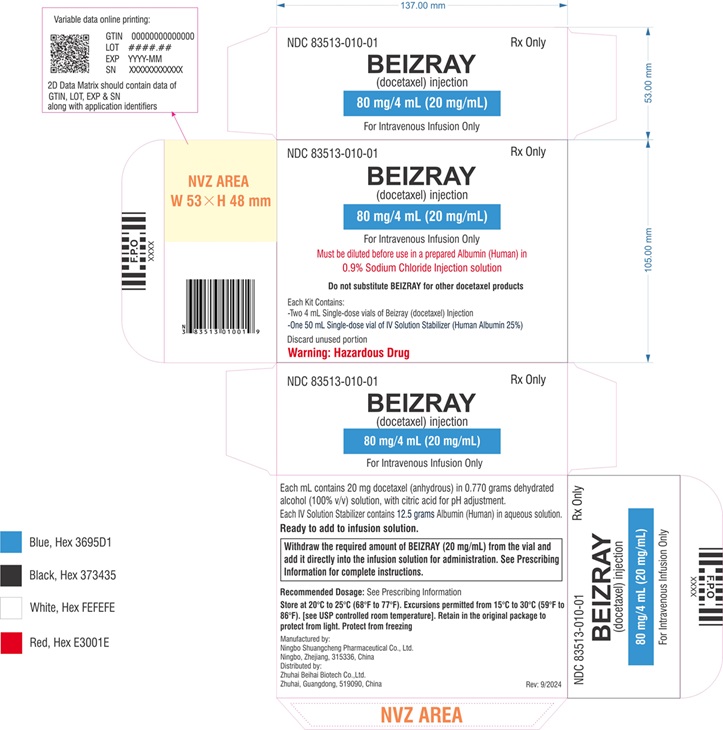
The BEIZRAY (docetaxel) injection label shows a 20 mg/mL strength in 80 mg/4 mL solution for intravenous infusion only. The label includes product name, strength, route, and warnings such as the need for dilution in 0.9% sodium chloride injection solution and a hazardous drug warning. It lists kit contents, manufacturer Zhuhai Beihai Biotech Co., Ltd., and storage instructions with recommended dosage referencing prescribing information.*
FDA Label Image

Kit-pic (Kit Pic)

Kit-pic (Kit Pic)
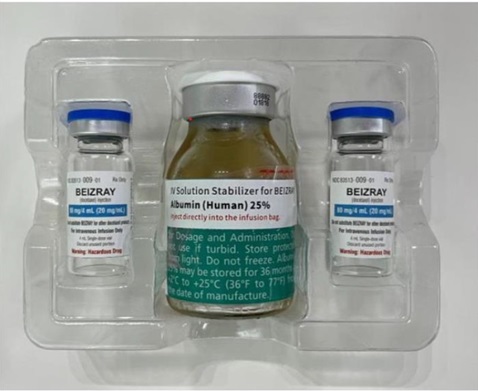
BEIZRAY 20 mg/mL injection solution by Zhuhai Beihai Biotech Co., Ltd. The image shows two small vials labeled BEIZRAY, each containing 1 mL of a 20 mg/mL Docetaxel solution, alongside a central vial with a solution stabilizer of 25% human albumin. This injection is intended for intravenous use.*
FDA Label Image

Structure (Structure)

Structure (Structure)
Chemical structure diagram of docetaxel, the active ingredient in BEIZRAY injection solution. The image shows the molecular arrangement with multiple rings, hydroxyl groups, and phenyl groups characteristic of docetaxel's complex taxane structure.*
FDA Label Image

Vial-label-9-29 (Vial Label 9 29)

Vial-label-9-29 (Vial Label 9 29)
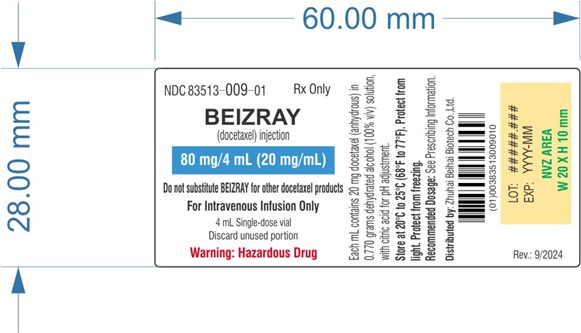
BEIZRAY (docetaxel) injection 80 mg/4 mL (20 mg/mL) label for intravenous infusion injection solution. The label specifies a 4 mL single-dose vial and cautions not to substitute for other docetaxel products. Includes warnings about hazardous drug status and storage instructions. Distributed by Zhuhai Beihai Biotech Co., Ltd.*

* About these descriptions: Image descriptions on this page are generated by automated AI analysis of the product label images from the manufacturer's FDA label submission (SPL). They are provided for reference only and may contain errors or omissions. Always rely on the printed label itself and the official FDA labeling, and consult a pharmacist or healthcare professional with any questions about this product.