Fulvestrant Injection, Solution
Product Images NDC 83634-203

View Photos of Packaging, Regulatory Labels, and Product Appearance

Product Visual Gallery

This gallery contains 16 technical images submitted to the FDA as part of the official labeling for Fulvestrant (NDC 83634-203). Unlike standard consumer photos, these assets often include clinical data figures, molecular chemical structures, and official manufacturer packaging layouts.

As provided by Avenacy, Inc., these visuals offer a comprehensive scientific overview of the product's physical and chemical identity, aiding pharmacists and researchers in product verification and study.

FDA Label Image

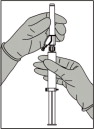
Figure 1 (Ful0c 0000 01)

Figure 1 (Ful0c 0000 01)
An instructional illustration showing how to prepare an injection. It depicts twisting and assembling components of a syringe or vial adapter before use, including specific parts labeled A, B, and C for identification.*
FDA Label Image

Figure 2 (Ful0c 0000 02)

Figure 2 (Ful0c 0000 02)
An instructional illustration showing the procedure for preparing an intramuscular injection using a vial and syringe. The image depicts a hand attaching a needle or syringe to a vial cap, highlighting different parts labeled A, B, and C on the vial or syringe components.*
FDA Label Image

Figure 3 (Ful0c 0000 03)

Figure 3 (Ful0c 0000 03)
An instructional illustration showing a pair of hands preparing an intramuscular injection. One hand holds a vial with a flip-top cap, while the other hand is drawing the solution into a syringe with a needle, demonstrating the proper technique for medication preparation.*
FDA Label Image

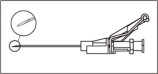
Figure 4 (Ful0c 0000 04)

Figure 4 (Ful0c 0000 04)
An instructional diagram showing a syringe and needle assembly, likely illustrating proper injection technique or syringe components for an intramuscular injection.*
FDA Label Image

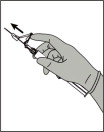
Figure 5 (Ful0c 0000 05)

Figure 5 (Ful0c 0000 05)
An instructional illustration showing a gloved hand holding a syringe, demonstrating how to properly handle or manipulate the syringe before administration. Arrows indicate the motion of the thumb and fingers on the syringe plunger and barrel.*
FDA Label Image

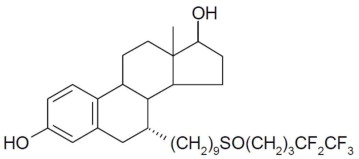
Structural Formula (Ful0c 0000 06)

Structural Formula (Ful0c 0000 06)
Chemical structure of fulvestrant, showing its steroid backbone with hydroxyl groups and fluorinated side chain, consistent with the active ingredient fulvestrant used in injection form.*
FDA Label Image

Figure 6 (Ful0c 0000 07)

Figure 6 (Ful0c 0000 07)
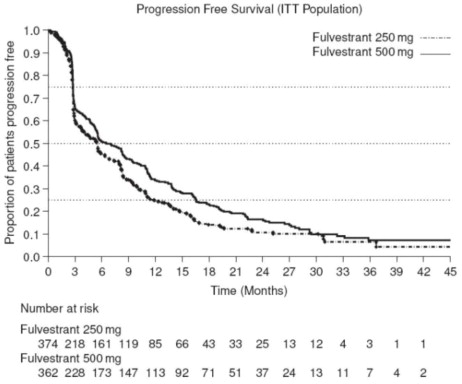
A line graph titled 'Progression Free Survival (ITT Population)' showing the proportion of patients progression free over time in months, comparing fulvestrant 250 mg and 500 mg doses. The x-axis represents time (0 to 45 months), and the y-axis shows the proportion of patients progression free (0 to 1.0). The graph includes a table below listing the number of patients at risk for each dose over time.*
FDA Label Image

Figure 7 (Ful0c 0000 08)

Figure 7 (Ful0c 0000 08)
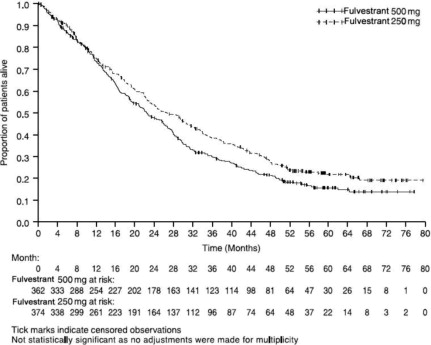
A Kaplan-Meier survival curve chart depicting the proportion of patients alive over time in months for two groups receiving Fulvestrant 500 mg and Fulvestrant 250 mg. The x-axis represents time in months up to 80 months, and the y-axis shows the proportion of patients alive from 0.0 to 1.0. The chart includes tick marks indicating censored observations and tables of patients at risk at various time points for both dosage groups.*
FDA Label Image

Figure 8 (Ful0c 0000 09)

Figure 8 (Ful0c 0000 09)
A Kaplan-Meier survival curve showing the probability of progression-free survival (PFS) over time in months from randomisation. The graph compares PFS for two treatments, Fulvestrant and Anastrozole 1 mg, with the number of patients at risk listed below the x-axis.*
FDA Label Image

Figure 9 (Ful0c 0000 10)

Figure 9 (Ful0c 0000 10)
A line graph depicting progression-free survival probability (%) over time in months for two treatment groups: fulvestrant with palbociclib and fulvestrant with placebo. The graph includes a legend and a table indicating the number of patients at risk at various time points for each group.*
FDA Label Image

Figure 10 (Ful0c 0000 11)

Figure 10 (Ful0c 0000 11)
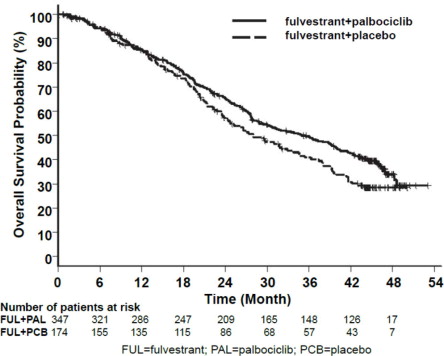
A Kaplan-Meier survival curve showing overall survival probability (%) over time in months for two groups: fulvestrant plus palbociclib and fulvestrant plus placebo. The graph includes patient numbers at risk over time for both groups and demonstrates survival trends up to 54 months.*
FDA Label Image

Figure 11 (Ful0c 0000 12)

Figure 11 (Ful0c 0000 12)
A Kaplan-Meier plot showing progression-free survival probability (%) over time in months for two groups: Fulvestrant plus Abemaciclib (solid line) and Fulvestrant plus Placebo (dashed line). The graph includes censored observations and a table of patients at risk for each group at various time points up to 30 months.*
FDA Label Image

Figure 12 (Ful0c 0000 13)

Figure 12 (Ful0c 0000 13)
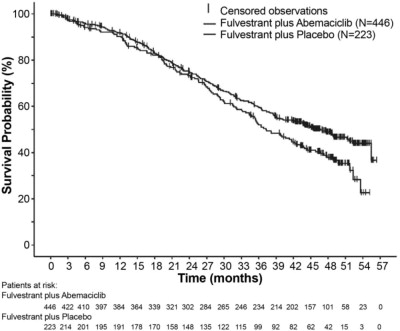
A Kaplan-Meier survival curve chart showing survival probability (%) over time (months) for patients treated with Fulvestrant plus Abemaciclib compared to Fulvestrant plus Placebo. The chart includes censored observations and a table indicating patient numbers at risk over time for each treatment group.*
FDA Label Image

Figure 13 (Ful0c 0000 14)

Figure 13 (Ful0c 0000 14)
A Kaplan-Meier curve showing event-free probability (%) over time in months for two treatment groups: Fulvestrant+Ribociclib (N=484) and Fulvestrant+Placebo (N=242). The graph includes censoring times indicated with markers and a table below showing the number of patients at risk at various time points up to 26 months.*
FDA Label Image

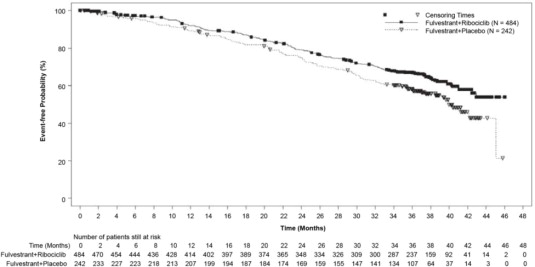
Figure 14 (Ful0c 0000 15)

Figure 14 (Ful0c 0000 15)
A Kaplan-Meier curve chart comparing event-free probability over time (in months) between two treatment groups: Fulvestrant plus Ribociclib and Fulvestrant plus Placebo. The x-axis indicates time in months up to 48 months, and the y-axis shows event-free probability percentage from 0 to 100. Censoring times and patient numbers at risk are also displayed below the graph.*
FDA Label Image

Package Label – Principal Display Panel – Syringe Label (Ful0c 0000 16)

Package Label – Principal Display Panel – Syringe Label (Ful0c 0000 16)
Label for Fulvestrant Injection 250 mg per 5 mL (50 mg per mL) prefilled syringe by Avenacy, Inc. The label indicates the product is for intramuscular use only and must be protected from light. It includes space for date/site and administrator information, a barcode, and states that two single-dose syringes are needed for a 500 mg dose. The product is manufactured for Avenacy in Schaumburg, IL, USA, and made in China.*

* About these descriptions: Image descriptions on this page are generated by automated AI analysis of the product label images from the manufacturer's FDA label submission (SPL). They are provided for reference only and may contain errors or omissions. Always rely on the printed label itself and the official FDA labeling, and consult a pharmacist or healthcare professional with any questions about this product.