Bortezomib Injection, Powder, Lyophilized, For Solution
Product Images NDC 83634-208

View Photos of Packaging, Regulatory Labels, and Product Appearance

Product Visual Gallery

This gallery contains 8 technical images submitted to the FDA as part of the official labeling for Bortezomib (NDC 83634-208). Unlike standard consumer photos, these assets often include clinical data figures, molecular chemical structures, and official manufacturer packaging layouts.

As provided by Avenacy, Llc, these visuals offer a comprehensive scientific overview of the product's physical and chemical identity, aiding pharmacists and researchers in product verification and study.

FDA Label Image

Chemical Structure (Bor07 0001 01)
Chemical Structure (Bor07 0001 01)
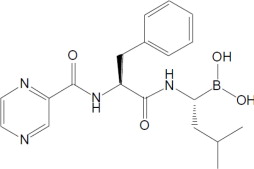
Chemical structure diagram of bortezomib, showing its molecular bonds and atomic arrangement, consistent with the active ingredient in Bortezomib injection, lyophilized, 3.5 mg/1 vial by Avenacy, LLC.*
FDA Label Image

Figure 1 (Bor07 0001 02)

Figure 1 (Bor07 0001 02)
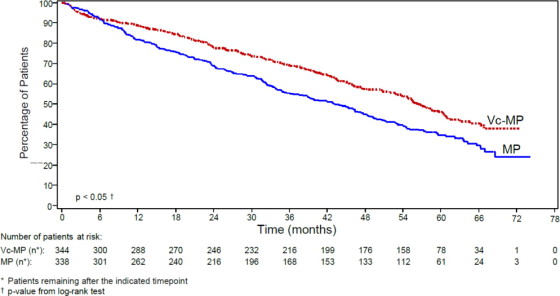
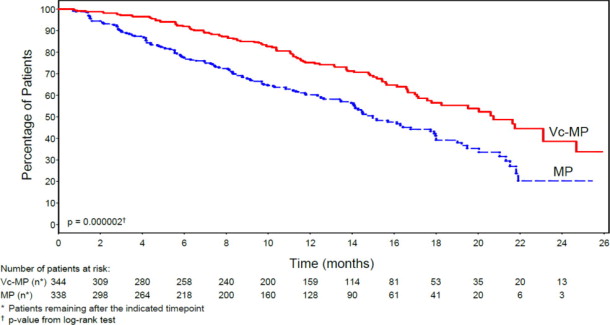
A Kaplan-Meier survival curve showing the percentage of patients over time in months for two groups labeled Vc-MP (red line) and MP (blue line). The graph includes a p-value from a log-rank test and a table indicating the number of patients at risk at various time points.*
FDA Label Image

Figure 2 (Bor07 0001 03)

Figure 2 (Bor07 0001 03)
A line graph depicting patient survival over time in months, comparing two groups labeled Vc-MP and MP. The y-axis represents percentage of patients remaining, ranging from 0 to 100%, while the x-axis shows time in months up to 78. The graph includes statistical data with p-value < 0.05 and patient counts at risk below the x-axis.*
FDA Label Image

Figure 3 (Bor07 0001 04)

Figure 3 (Bor07 0001 04)
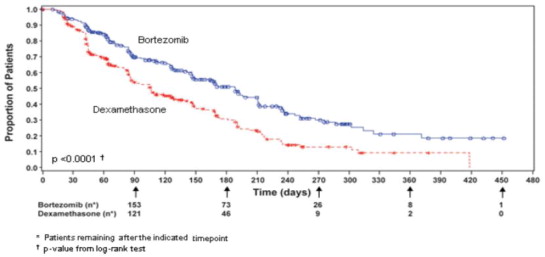
A Kaplan-Meier survival curve comparing the proportion of patients over time (days) between those treated with Bortezomib and Dexamethasone. The graph shows the number of patients remaining at selected time points and includes a p-value from a log-rank test indicating statistical significance.*
FDA Label Image

Figure 4 (Bor07 0001 05)

Figure 4 (Bor07 0001 05)
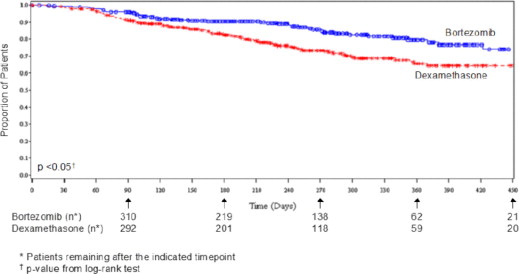
A Kaplan-Meier survival curve graph displaying the proportion of patients over time (days) treated with Bortezomib compared to Dexamethasone. The graph includes patient counts at specified time points and indicates a statistically significant difference with a p-value less than 0.05.*
FDA Label Image

Figure 5 (Bor07 0001 06)

Figure 5 (Bor07 0001 06)
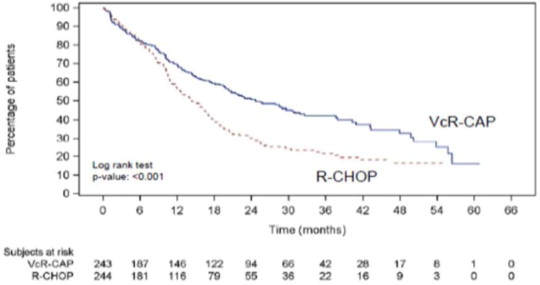
A Kaplan-Meier survival curve chart depicting the percentage of patients over time in months. Two groups are compared: VcR-CAP and R-CHOP, with a log rank test p-value of less than 0.001 indicating statistical significance. The chart includes a table of subjects at risk for both groups at different time points.*
FDA Label Image

Figure 6 (Bor07 0001 07)

Figure 6 (Bor07 0001 07)
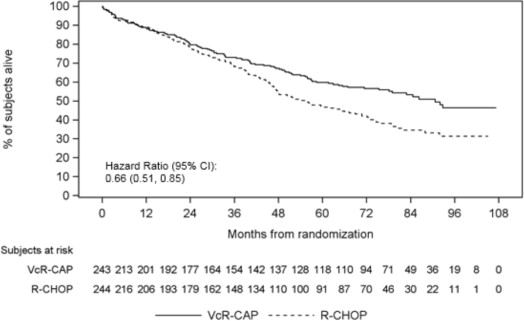
A Kaplan-Meier survival curve chart depicting the percentage of subjects alive over months from randomization, comparing two treatment groups labeled as VcR-CAP (solid line) and R-CHOP (dashed line). The chart includes a hazard ratio (95% CI): 0.66 (0.51, 0.85) and a table showing the number of subjects at risk for each group at various time points up to 108 months.*
FDA Label Image

Package Label (PRINCIPAL DISPLAY PANEL – Vial Label)

Package Label (PRINCIPAL DISPLAY PANEL – Vial Label)
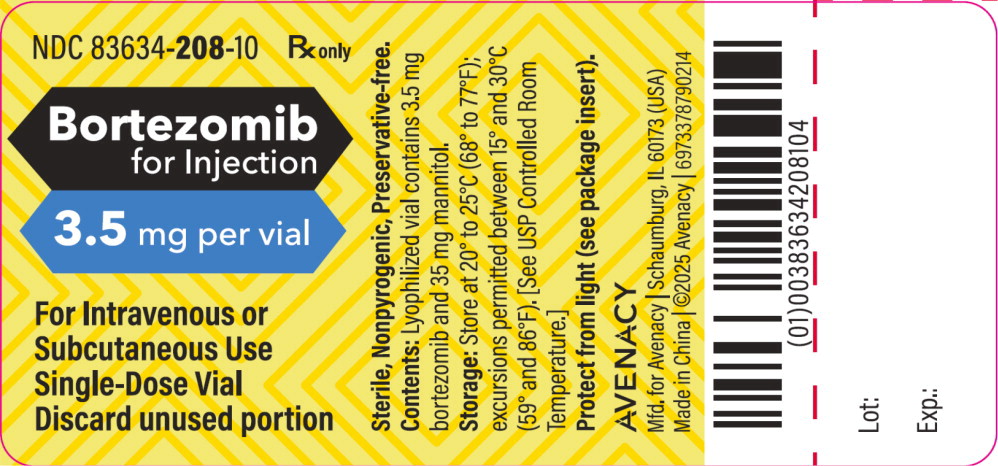
Bortezomib for Injection 3.5 mg per vial label for intravenous or subcutaneous use. It is a sterile, nonpyrogenic, preservative-free, lyophilized powder vial. The label includes storage instructions, manufacturer Avenacy, LLC, and NDC 83634-208-10 with a barcode.*

* About these descriptions: Image descriptions on this page are generated by automated AI analysis of the product label images from the manufacturer's FDA label submission (SPL). They are provided for reference only and may contain errors or omissions. Always rely on the printed label itself and the official FDA labeling, and consult a pharmacist or healthcare professional with any questions about this product.