Capecitabine
Product Images NDC 83774-101

View Photos of Packaging, Regulatory Labels, and Product Appearance

Product Visual Gallery

This gallery contains 8 technical images submitted to the FDA as part of the official labeling for Capecitabine (NDC 83774-101). Unlike standard consumer photos, these assets often include clinical data figures, molecular chemical structures, and official manufacturer packaging layouts.

As provided by Pilnova Pharma Inc, these visuals offer a comprehensive scientific overview of the product's physical and chemical identity, aiding pharmacists and researchers in product verification and study.

FDA Label Image

Structuralformula (Ab3f3920 2554 4b1f B965 9b41035ab21b 01)

Structuralformula (Ab3f3920 2554 4b1f B965 9b41035ab21b 01)
Chemical structure of Capecitabine, showing its molecular arrangement with characteristic fluorine, carbon, oxygen, nitrogen, and hydrogen atoms.*
FDA Label Image

Figure 1 Kaplan-meier Estimates Of Disease-free Survival (all Randomized Population)a (Ab3f3920 2554 4b1f B965 9b41035ab21b 02)

Figure 1 Kaplan-meier Estimates Of Disease-free Survival (all Randomized Population)a (Ab3f3920 2554 4b1f B965 9b41035ab21b 02)
A survival plot comparing two treatment groups: 5-FU + Leucovorin and Capecitabine over months since randomization. The y-axis shows survival probability from 0.0 to 1.0, and the x-axis shows time in months up to 96. Both groups show a gradual decline in survival over time with similar trends. The number of patients at risk for each group is indicated below the x-axis at various time points.*
FDA Label Image

Figure 2 Kaplan-meier Estimates Of Overall Survival (all Randomized Population) (Ab3f3920 2554 4b1f B965 9b41035ab21b 03)

Figure 2	Kaplan-meier Estimates Of Overall Survival (all Randomized Population) (Ab3f3920 2554 4b1f B965 9b41035ab21b 03)
A survival curve chart comparing two treatment groups: Capecitabine and 5-FU + Leucovorin. The x-axis represents months since randomization, ranging from 0 to 96, and the y-axis represents survival probability from 0.0 to 1.0. The chart shows the number of patients at risk at various time points for each group, with Capecitabine represented by a solid line and 5-FU + Leucovorin by a dashed line.*
FDA Label Image

.. (Ab3f3920 2554 4b1f B965 9b41035ab21b 04)

.. (Ab3f3920 2554 4b1f B965 9b41035ab21b 04)
A Kaplan-Meier survival probability graph comparing 5-FU + Leucovorin (Mayo Regimen) and Capecitabine 1250 mg/sqm twice daily intermittent regimens over time in days. The y-axis shows estimated probability from 0 to 1, and the x-axis shows time up to 1500 days. Two survival curves decline over time, representing the two treatment groups.*
FDA Label Image

Figure 4 Kaplan-meier Estimates For Time To Disease Progression Capecitabine And Docetaxel Vs Docetaxel (Ab3f3920 2554 4b1f B965 9b41035ab21b 05)

Figure 4 	Kaplan-meier Estimates For Time To Disease Progression Capecitabine And Docetaxel Vs Docetaxel (Ab3f3920 2554 4b1f B965 9b41035ab21b 05)
A Kaplan-Meier survival curve chart showing estimated probability over time in days up to 800 days. It compares two treatment groups: Docetaxel 100 mg/sqm every 3 weeks (dashed line) and Capecitabine 1250 mg/sqm twice daily intermittent with docetaxel 75 mg/sqm every 3 weeks (solid line). The chart includes probability values with arrows marking 128 and 186 days on the time axis.*
FDA Label Image

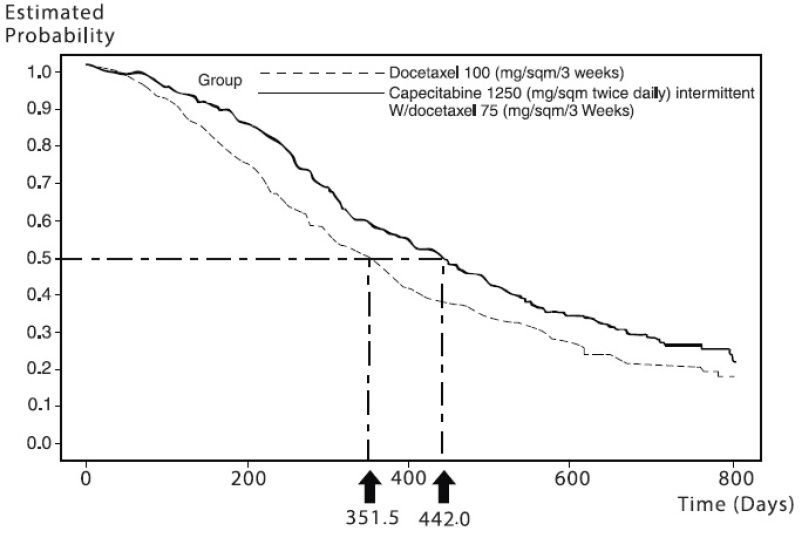
Figure 5 Kaplan-meier Estimates Of Survival Capecitabine And Docetaxel Vs Docetaxel (Ab3f3920 2554 4b1f B965 9b41035ab21b 06)

Figure 5 Kaplan-meier Estimates Of Survival Capecitabine And Docetaxel Vs Docetaxel (Ab3f3920 2554 4b1f B965 9b41035ab21b 06)
A Kaplan-Meier survival curve comparing estimated probability over time (days) between two groups: Docetaxel 100 mg/sqm every 3 weeks (dashed line) and Capecitabine 1250 mg/sqm twice daily intermittent with Docetaxel 75 mg/sqm every 3 weeks (solid line). The graph includes vertical markers at approximately 351.5 and 442.0 days corresponding to median survival times for each group.*
FDA Label Image

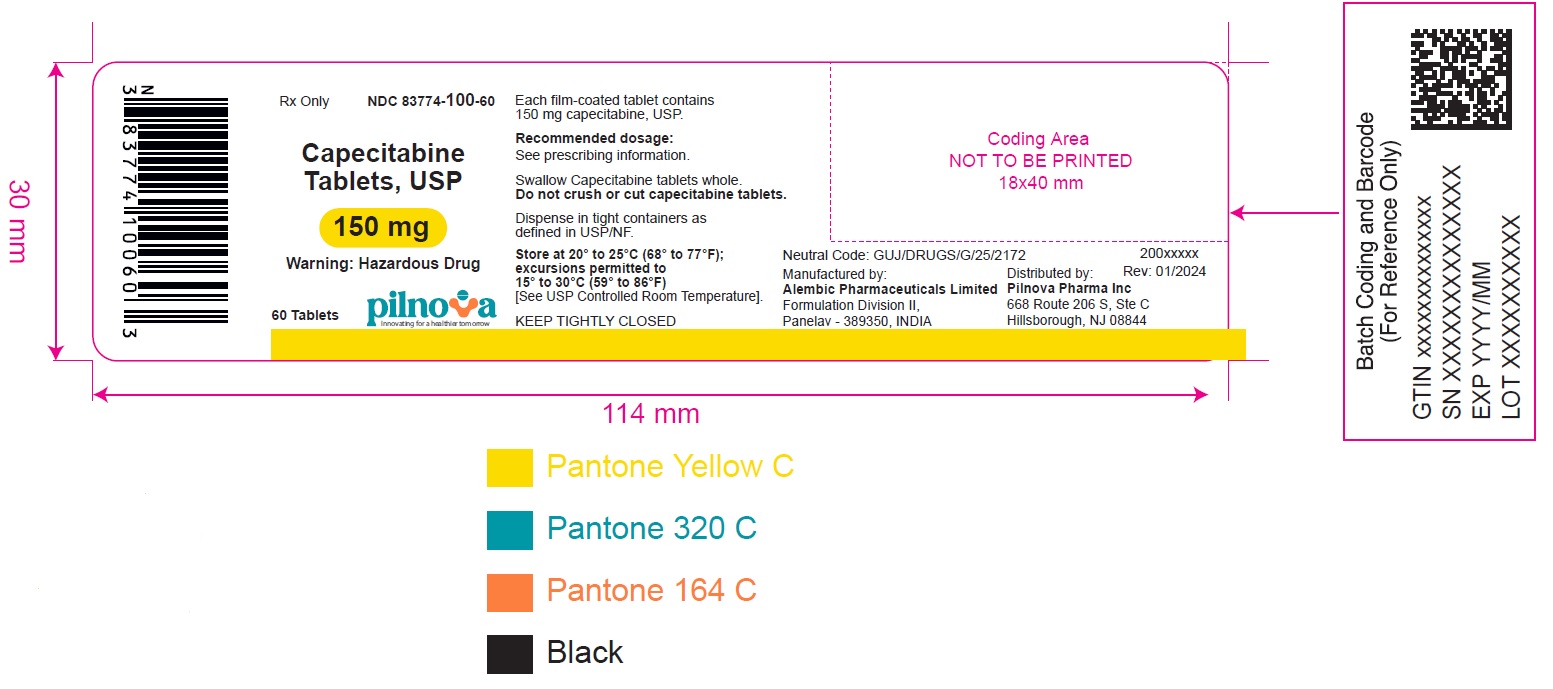
150mg (Ab3f3920 2554 4b1f B965 9b41035ab21b 07)

150mg (Ab3f3920 2554 4b1f B965 9b41035ab21b 07)
Label for Capecitabine tablets, USP 150 mg, by Pilnova Pharma Inc. The label states it contains 60 film-coated tablets, includes storage instructions, and identifies Alembic Pharmaceuticals Limited as the manufacturer. It features a barcode, a warning of hazardous drug, and batch coding details.*
FDA Label Image

500mg (Ab3f3920 2554 4b1f B965 9b41035ab21b 08)

500mg (Ab3f3920 2554 4b1f B965 9b41035ab21b 08)
Capecitabine Tablets, USP 500 mg film-coated tablet label by Pilnova Pharma Inc. The label indicates the product contains 120 tablets, is a hazardous drug, and includes storage instructions at 20° to 25°C with permitted excursions. The label features the NDC 83774-101-12, manufacturer and distributor details, and a barcode. The branding uses blue, teal, orange, and yellow Pantone colors.*

* About these descriptions: Image descriptions on this page are generated by automated AI analysis of the product label images from the manufacturer's FDA label submission (SPL). They are provided for reference only and may contain errors or omissions. Always rely on the printed label itself and the official FDA labeling, and consult a pharmacist or healthcare professional with any questions about this product.