Docivyx Injection, Solution
Product Images NDC 83831-101

19 FDA label images from Avyxa Pharma, Llc · Packaging, Regulatory Labels, and Product Appearance

Product Visual Gallery

This gallery contains 19 technical images submitted to the FDA as part of the official labeling for Docivyx (NDC 83831-101). Unlike standard consumer photos, these assets often include clinical data figures, molecular chemical structures, and official manufacturer packaging layouts.

As provided by Avyxa Pharma, Llc, these visuals offer a comprehensive scientific overview of the product's physical and chemical identity, aiding pharmacists and researchers in product verification and study.

FDA Label Image

Docetaxel-structure (6d914dea 626d 4402 8fce 29760fd0e34f 01)
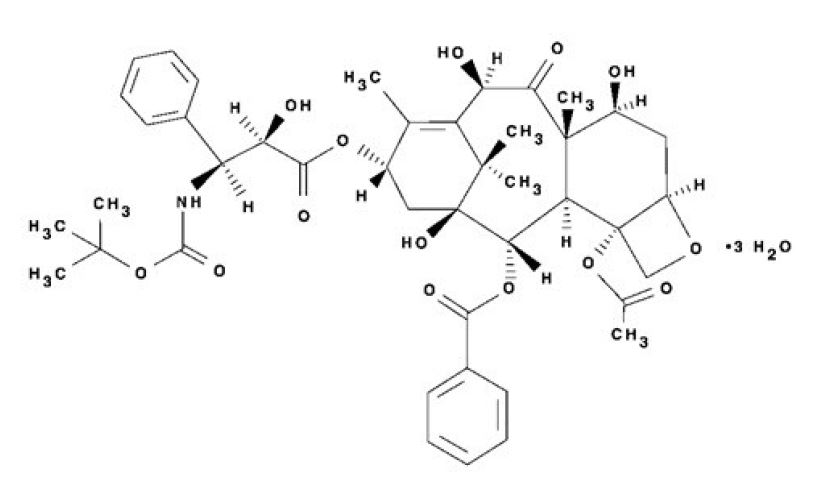
Docetaxel-structure (6d914dea 626d 4402 8fce 29760fd0e34f 01)
Chemical structure of docetaxel, the active ingredient in DOCIVYX injection solution, showing its molecular framework with various functional groups and stereochemistry. The structure includes multiple rings, hydroxyl groups, and ester linkages, consistent with the taxane class of compounds.*
FDA Label Image

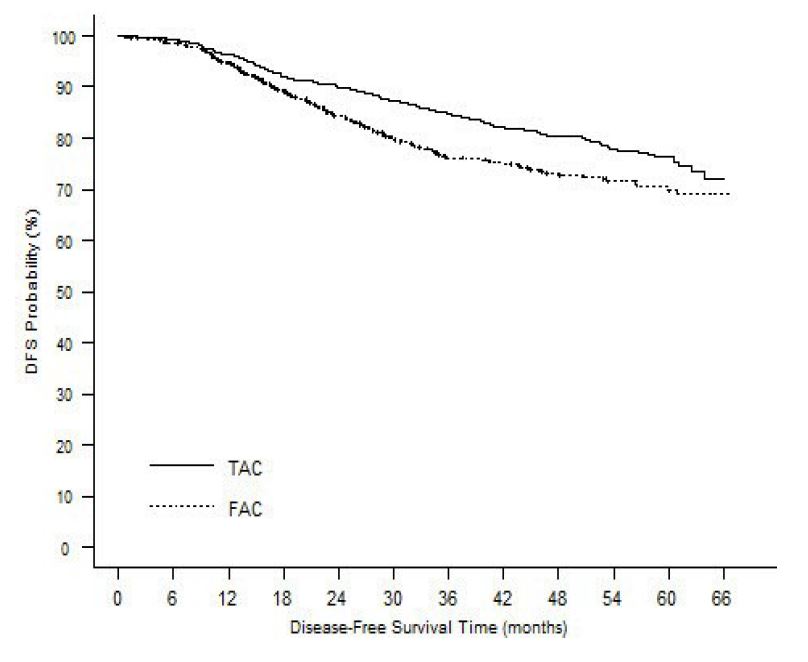
Figure 1: Tax316 Disease-free Survival K-m Curve (6d914dea 626d 4402 8fce 29760fd0e34f 02)

Figure 1: Tax316 Disease-free Survival K-m Curve (6d914dea 626d 4402 8fce 29760fd0e34f 02)
A line graph depicting Disease-Free Survival (DFS) Probability (%) over Disease-Free Survival Time in months for two treatment groups labeled TAC and FAC. The graph shows DFS probability declining over time from 0 to 66 months, with TAC represented by a solid line and FAC by a dotted line, indicating comparative survival analysis.*
FDA Label Image

Image (6d914dea 626d 4402 8fce 29760fd0e34f 03)

Image (6d914dea 626d 4402 8fce 29760fd0e34f 03)
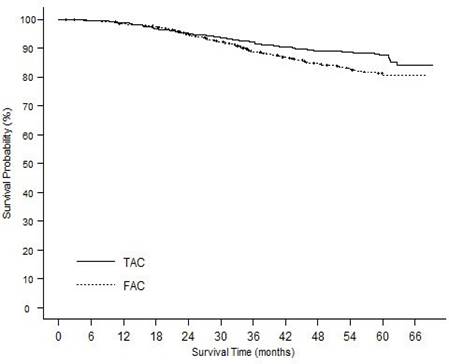
A Kaplan-Meier survival curve graph showing survival probability over time in months. The plot compares two treatment groups labeled TAC (solid line) and FAC (dotted line), depicting their survival probabilities (%) on the y-axis across approximately 66 months on the x-axis.*
FDA Label Image

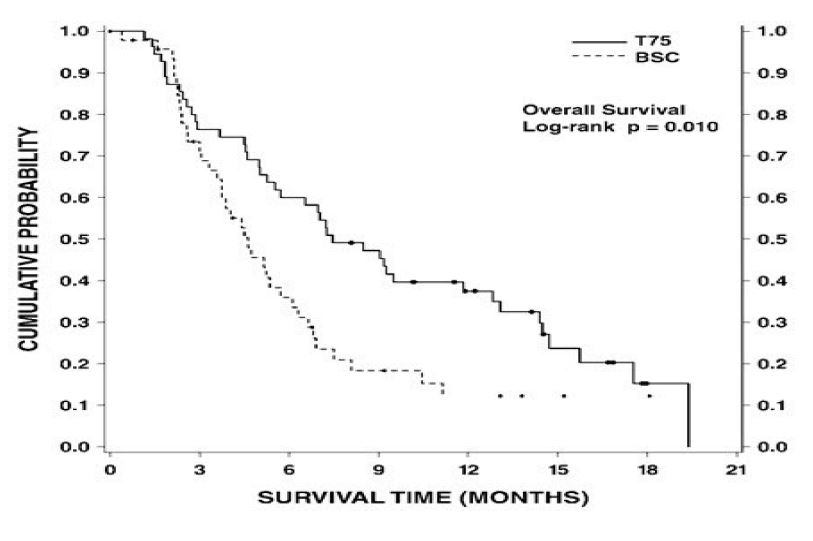
Figure 3: Tax317 Survival K-m Curves (DOCIVYX 75 mg/m2 Versus Best Supportive Care)

Figure 3: Tax317 Survival K-m Curves (DOCIVYX 75 mg/m2 Versus Best Supportive Care)
A Kaplan-Meier survival curve chart showing overall survival probability over time in months. Two groups, labeled T75 (solid line) and BSC (dashed line), are compared with cumulative probability on the vertical axis. The chart includes a log-rank p-value of 0.010 indicating statistical comparison between groups.*
FDA Label Image

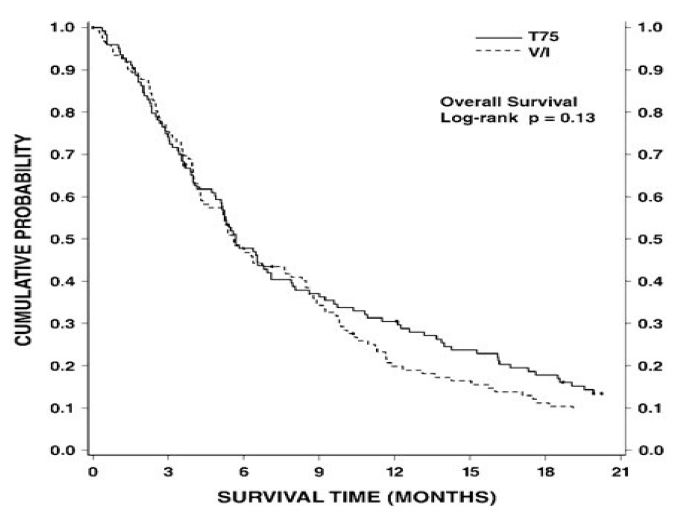
Figure 4: Tax320 Survival K-m Curves (DOCIVYX 75 mg/m2 Versus Vinorelbine or Ifosfamide Control)

Figure 4: Tax320 Survival K-m Curves (DOCIVYX 75 mg/m2 Versus Vinorelbine or Ifosfamide Control)
A survival curve plot showing overall survival probability over time in months. The cumulative probability is plotted on the vertical axis, and survival time in months on the horizontal axis, with two treatment groups labeled T75 and V/I. The graph includes a log-rank p value of 0.13 for comparison between the groups.*
FDA Label Image

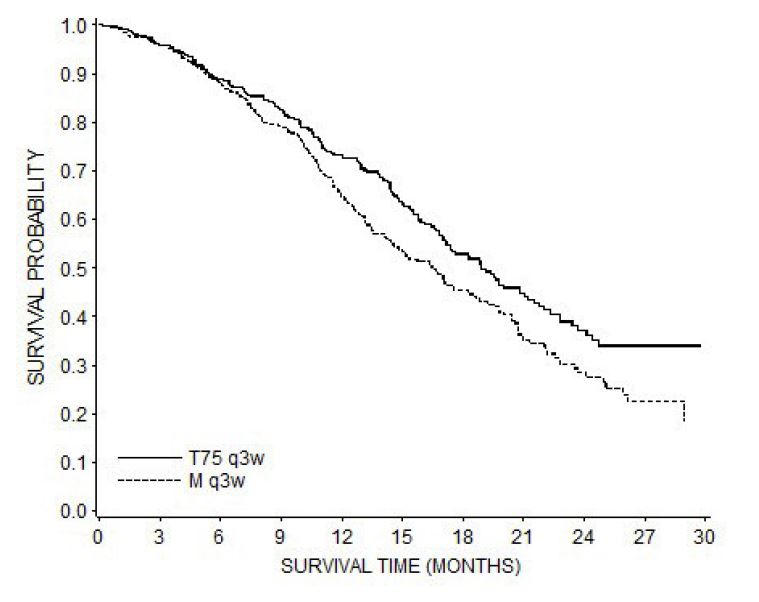
Figure 5: Tax327 Survival K-m Curves (6d914dea 626d 4402 8fce 29760fd0e34f 06)

Figure 5: Tax327 Survival K-m Curves (6d914dea 626d 4402 8fce 29760fd0e34f 06)
A survival probability curve chart depicting survival time in months on the x-axis and survival probability on the y-axis. Two lines represent different treatment groups labeled as T75 q3w and M q3w, showing comparative survival trends over approximately 30 months.*
FDA Label Image

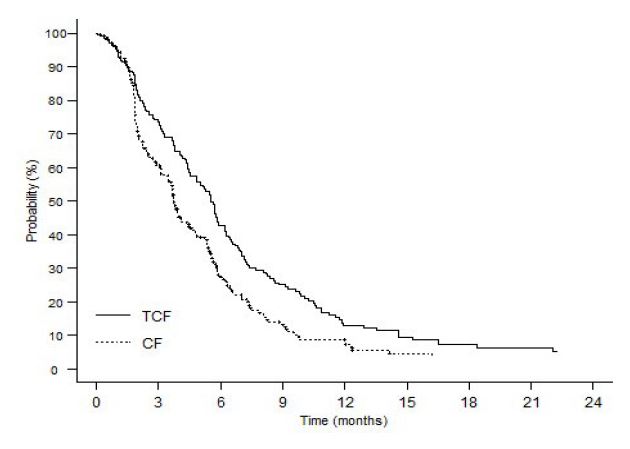
Figure 6: Gastric Cancer Study (tax325) Time To Progression K-m Curve (6d914dea 626d 4402 8fce 29760fd0e34f 07)

Figure 6: Gastric Cancer Study (tax325) Time To Progression K-m Curve (6d914dea 626d 4402 8fce 29760fd0e34f 07)
A Kaplan-Meier survival curve chart showing probability (%) on the y-axis versus time in months on the x-axis, comparing two treatment groups labeled TCF and CF. The TCF group has a higher survival probability over time than the CF group, with both decreasing to below 10% by 15 to 18 months.*
FDA Label Image

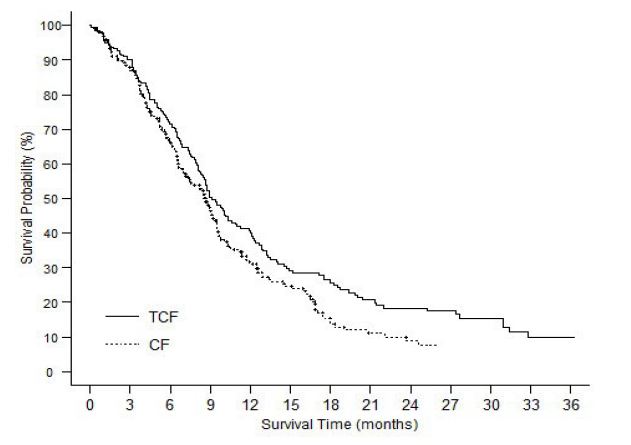
Figure 7: Gastric Cancer Study (tax325) Survival K-m Curve (6d914dea 626d 4402 8fce 29760fd0e34f 08)

Figure 7: Gastric Cancer Study (tax325) Survival K-m Curve (6d914dea 626d 4402 8fce 29760fd0e34f 08)
A survival curve graph depicting survival probability (%) over survival time in months for two groups labeled TCF and CF. The x-axis represents survival time from 0 to 36 months, and the y-axis shows survival probability from 0% to 100%. The TCF group shows a generally higher survival probability compared to the CF group over time.*
FDA Label Image

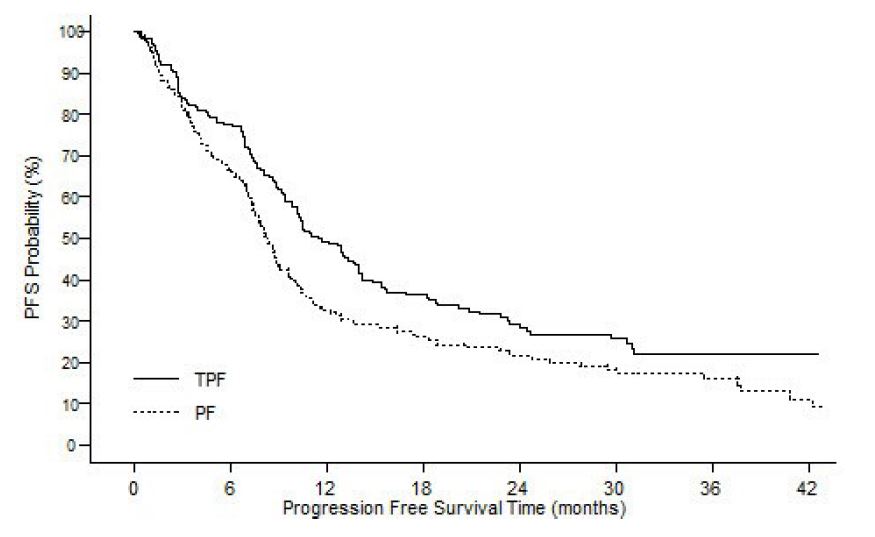
Figure 8: Tax323 Progression-free Survival K-m Curve (6d914dea 626d 4402 8fce 29760fd0e34f 09)

Figure 8: Tax323 Progression-free Survival K-m Curve (6d914dea 626d 4402 8fce 29760fd0e34f 09)
A Kaplan-Meier survival curve chart depicting progression-free survival (PFS) probability over time in months. Two groups are compared: TPF (solid line) and PF (dotted line), with PFS probability on the y-axis (%) and progression-free survival time on the x-axis (months).*
FDA Label Image

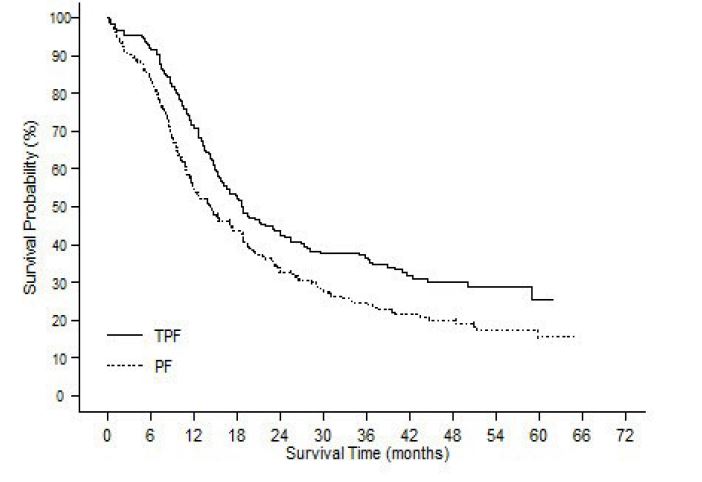
Figure 9: Tax323 Overall Survival K-m Curve (6d914dea 626d 4402 8fce 29760fd0e34f 10)

Figure 9: Tax323 Overall Survival K-m Curve (6d914dea 626d 4402 8fce 29760fd0e34f 10)
A survival probability Kaplan-Meier curve comparing two groups labeled TPF (solid line) and PF (dashed line) over time in months up to 72 months. The y-axis shows survival probability percentage from 0 to 100%, and the x-axis shows survival time in months from 0 to 72.*
FDA Label Image

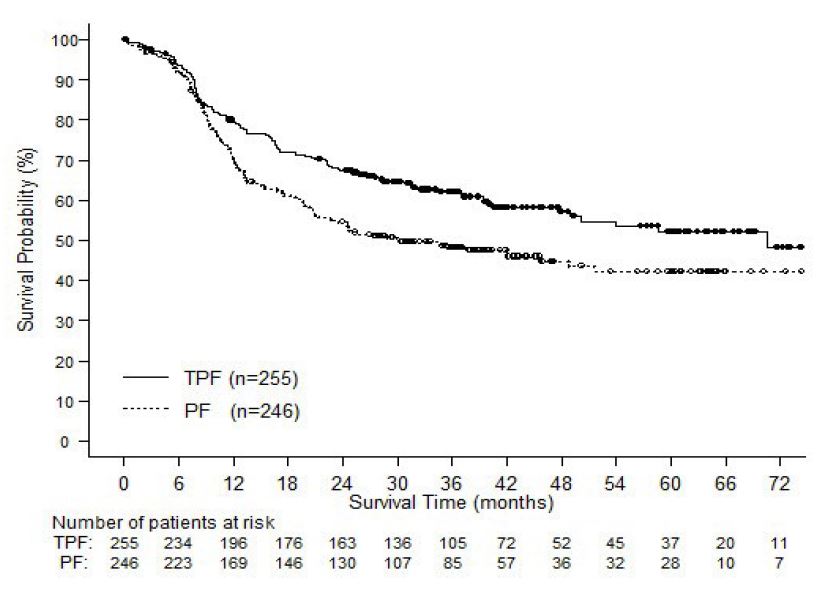
Figure 10: Tax324 Overall Survival K-m Curve (6d914dea 626d 4402 8fce 29760fd0e34f 11)

Figure 10: Tax324 Overall Survival K-m Curve (6d914dea 626d 4402 8fce 29760fd0e34f 11)
A survival probability Kaplan-Meier curve showing survival probability (%) on the vertical axis and survival time (months) on the horizontal axis. Two groups are compared: TPF (n=255) and PF (n=246), with TPF represented by a solid line and PF by a dotted line. The chart includes a table below indicating the number of patients at risk over time for each group.*
FDA Label Image

Image (E992c05a 6a2a 4929 B017 7b0a85e762fa 187 2)

FDA Label Image

Image (6d914dea 626d 4402 8fce 29760fd0e34f 213 2)

FDA Label Image

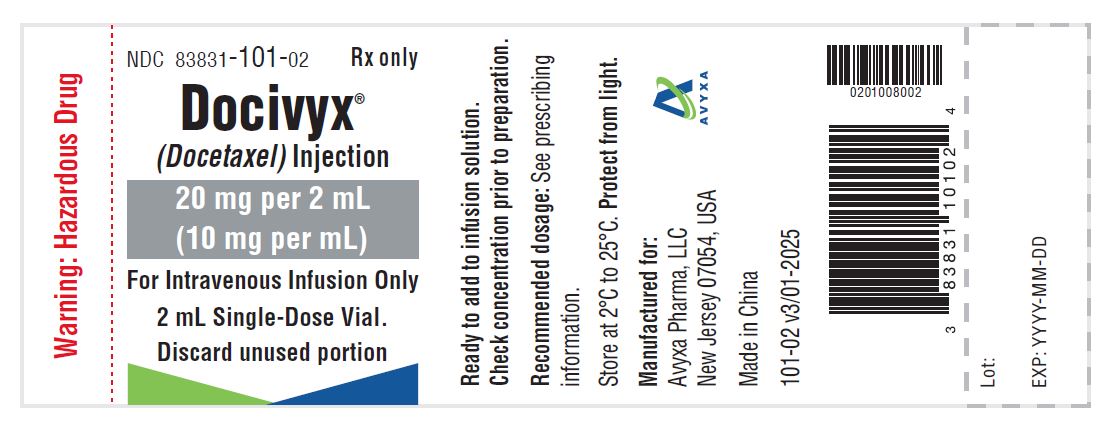
Docivyx (docetaxel) Injection, 20 mg/2 mL -vial Label (6d914dea 626d 4402 8fce 29760fd0e34f 12)

Docivyx (docetaxel) Injection, 20 mg/2 mL -vial Label (6d914dea 626d 4402 8fce 29760fd0e34f 12)
Label of DOCIVYX (docetaxel) injection 20 mg per 2 mL (10 mg per mL) intravenous infusion solution. The label specifies a 2 mL single-dose vial, with warnings about hazardous drug handling and discarding unused portion. Manufactured by Avyxa Pharma, LLC, made in China. Storage instructions note protection from light and temperature between 2°C to 25°C.*
FDA Label Image

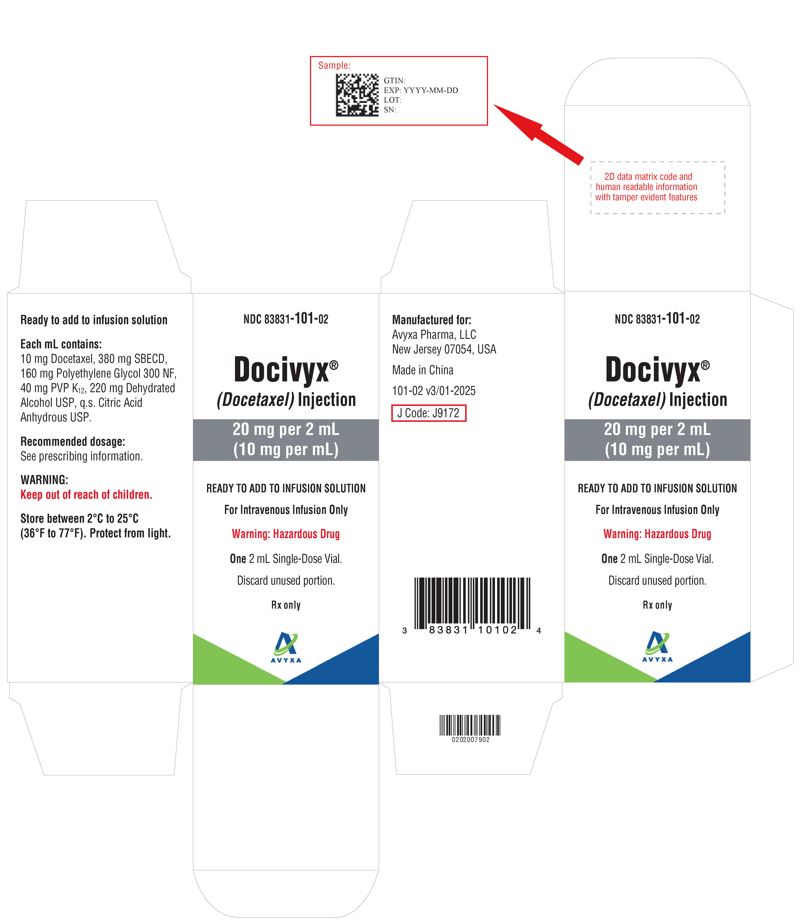
Docivyx (docetaxel) Injection, 20 mg/2 mL -carton Label (6d914dea 626d 4402 8fce 29760fd0e34f 13)

Docivyx (docetaxel) Injection, 20 mg/2 mL -carton Label (6d914dea 626d 4402 8fce 29760fd0e34f 13)
Packaging label for Docivyx (Docetaxel) Injection 20 mg per 2 mL (10 mg per mL) by Avyxa Pharma, LLC. The label states it is an intravenous injection ready to add to infusion solution with a single-dose 2 mL vial. It includes warnings about hazardous drug status, storage instructions, active ingredient quantities per mL, barcode, and manufacturing information indicating it is made in China for Avyxa Pharma in New Jersey, USA.*
FDA Label Image

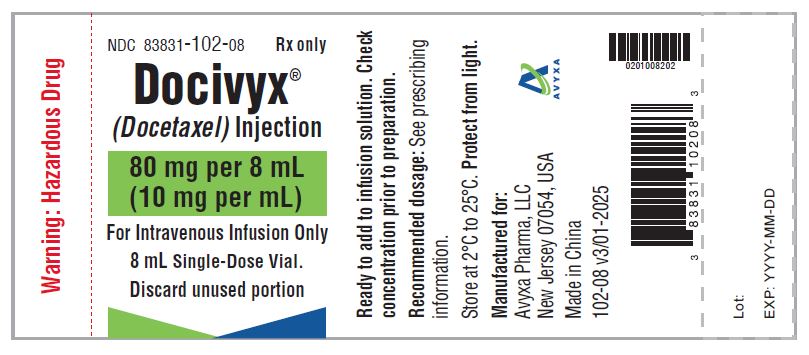
Docivyx (docetaxel) Injection, 80 mg/8 mL -vial Label (6d914dea 626d 4402 8fce 29760fd0e34f 14)

Docivyx (docetaxel) Injection, 80 mg/8 mL -vial Label (6d914dea 626d 4402 8fce 29760fd0e34f 14)
Label for Docivyx (docetaxel) Injection, 80 mg per 8 mL (10 mg per mL) single-dose vial for intravenous infusion. The label includes warnings such as 'Hazardous Drug,' storage instructions to keep at 2°C to 25°C and protect from light, and manufacturer information for Avyxa Pharma, LLC, New Jersey, USA. The label also advises discarding unused portions and checking concentration before preparation.*
FDA Label Image

Docivyx (docetaxel) Injection, 80 mg/8 mL -carton Label (6d914dea 626d 4402 8fce 29760fd0e34f 15)

Docivyx (docetaxel) Injection, 80 mg/8 mL -carton Label (6d914dea 626d 4402 8fce 29760fd0e34f 15)
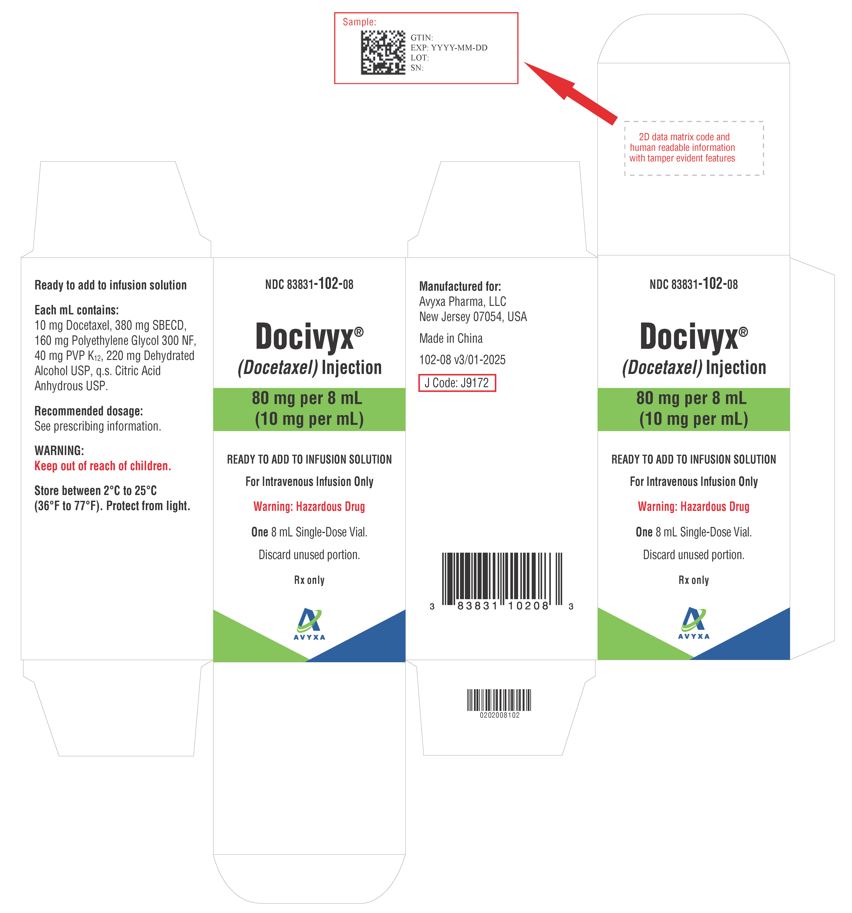
Carton label for Docivyx (Docetaxel) Injection, 80 mg per 8 mL (10 mg per mL), an intravenous infusion solution. The label includes storage instructions, warnings for hazardous drug handling, manufacturing details for Avyxa Pharma, LLC, and a barcode. The label also features a 2D data matrix code area with tamper-evident features and specifies the product is for single-dose use only.*
FDA Label Image

Docivyx (docetaxel) Injection, 160 mg/16 mL -vial Label (6d914dea 626d 4402 8fce 29760fd0e34f 16)

Docivyx (docetaxel) Injection, 160 mg/16 mL -vial Label (6d914dea 626d 4402 8fce 29760fd0e34f 16)
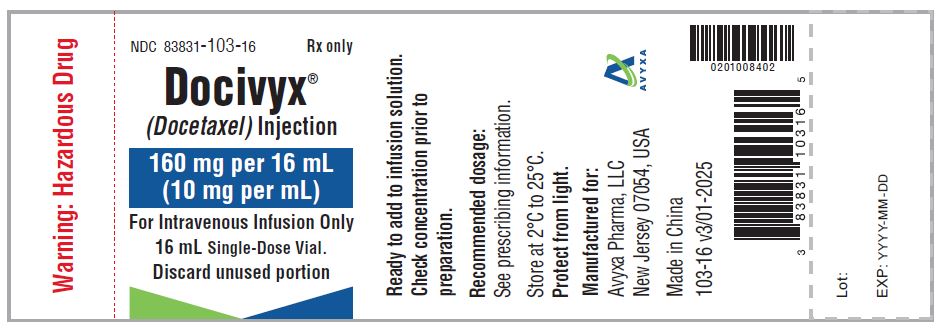
Label of DOCIVYX (docetaxel) Injection, solution for intravenous infusion, 160 mg per 16 mL (10 mg per mL). Single-dose vial containing 16 mL. The label includes storage instructions, manufacturer Avyxa Pharma, LLC, and warnings including 'Hazardous Drug' and 'Rx only.'*
FDA Label Image

Docivyx (docetaxel) Injection, 160 mg/16 mL -carton Label (6d914dea 626d 4402 8fce 29760fd0e34f 17)

Docivyx (docetaxel) Injection, 160 mg/16 mL -carton Label (6d914dea 626d 4402 8fce 29760fd0e34f 17)
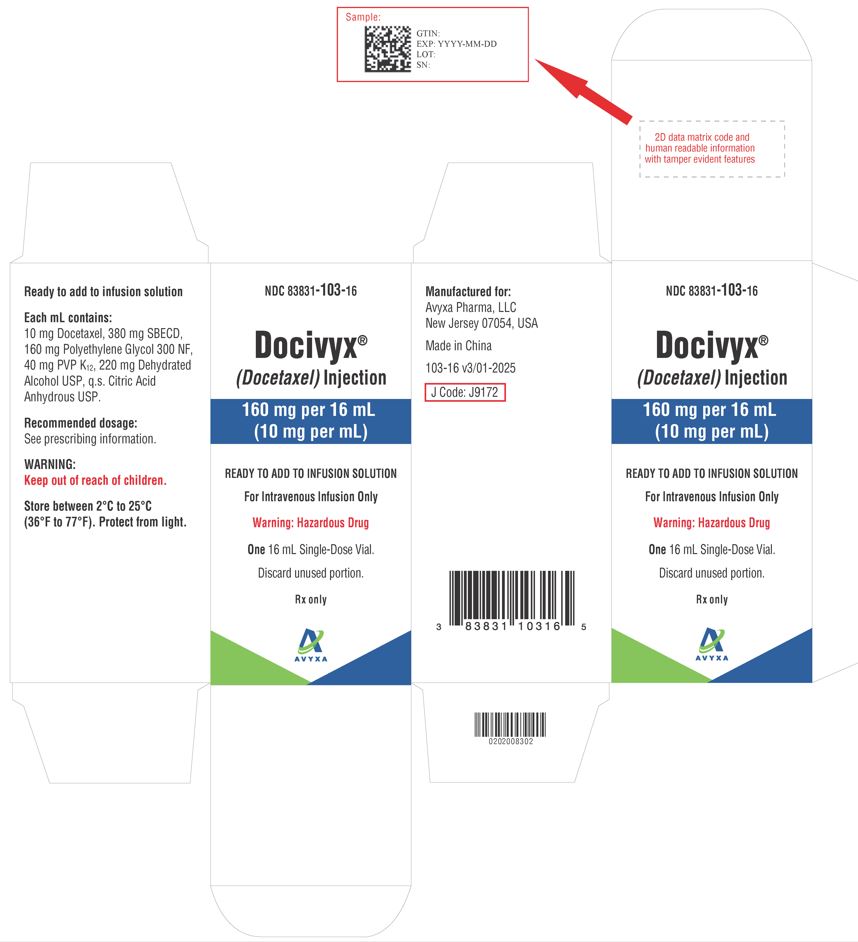
Box packaging label for Docivyx (docetaxel) Injection 160 mg per 16 mL (10 mg per mL) by Avyxa Pharma, LLC. The label states it is ready to add to infusion solution, for intravenous infusion, and single-dose vial. It includes warnings about it being a hazardous drug and instructions to keep out of reach of children, store between 2°C to 25°C, and protect from light. The label also shows active ingredients and barcode details.*

* About these descriptions: Image descriptions on this page are generated by automated AI analysis of the product label images from the manufacturer's FDA label submission (SPL). They are provided for reference only and may contain errors or omissions. Always rely on the printed label itself and the official FDA labeling, and consult a pharmacist or healthcare professional with any questions about this product.