Rocuronium Bromide Injection
Product Images NDC 84549-687

View Photos of Packaging, Regulatory Labels, and Product Appearance

Product Visual Gallery

This gallery contains 5 technical images submitted to the FDA as part of the official labeling for Rocuronium Bromide (NDC 84549-687). Unlike standard consumer photos, these assets often include clinical data figures, molecular chemical structures, and official manufacturer packaging layouts.

As provided by Propharma Distribution, these visuals offer a comprehensive scientific overview of the product's physical and chemical identity, aiding pharmacists and researchers in product verification and study.

FDA Label Image

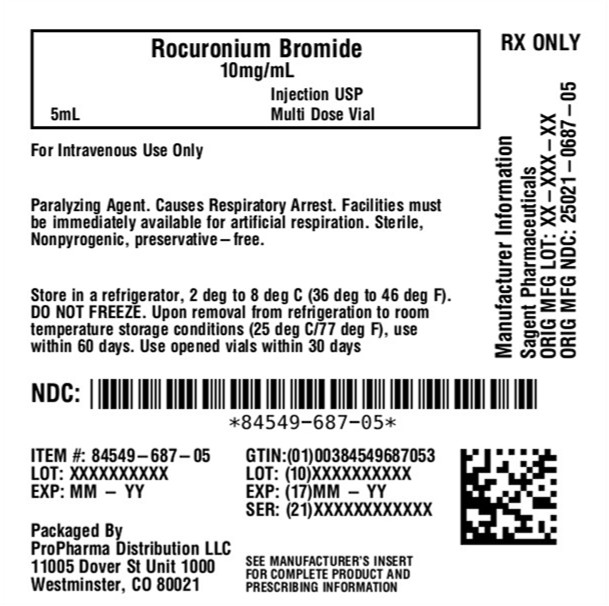
Vial (84549 687 05)

Vial (84549 687 05)
Label for Rocuronium Bromide Injection USP, 10 mg/mL, in a 5 mL multidose vial. It is for intravenous use only and paralyzing agent, sterile and preservative-free. Packaged by ProPharma Distribution LLC, Westminster, CO. Includes storage instructions and barcode with NDC 84549-687-05.*
FDA Label Image

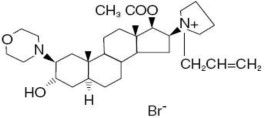
Structural Formula (Roc08 0000 01)

Structural Formula (Roc08 0000 01)
Chemical structure diagram of rocuronium bromide, showing the steroidal backbone with distinctive functional groups including a quaternary ammonium and bromide ion.*
FDA Label Image

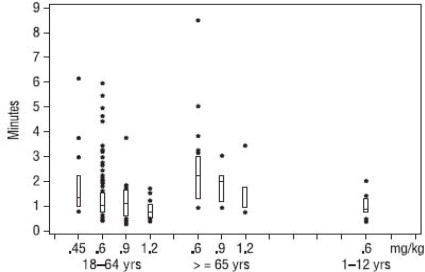
Figure 1 (Roc08 0000 02)

Figure 1 (Roc08 0000 02)
Box plot chart depicting data on minutes versus dosage in mg/kg across age groups: 18-64 years, 65 years and older, and 1-12 years. The x-axis presents dosage levels and age groups; the y-axis shows time in minutes. Individual data points are also plotted along with box plots.*
FDA Label Image

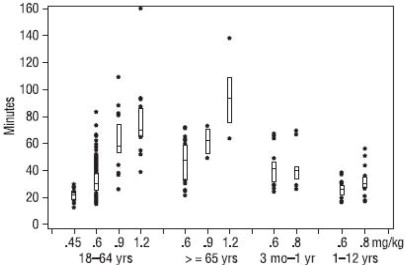
Figure 2 (Roc08 0000 03)

Figure 2 (Roc08 0000 03)
A scatter plot with box plots overlay showing minutes on the y-axis and dosage in mg/kg on the x-axis. Data points are grouped by age ranges: 18-64 years, 65 years and older, 3 months to 1 year, and 1-12 years, depicting variation in a measured time-related variable across these groups and dosages.*
FDA Label Image

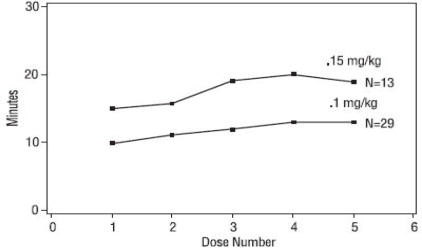
Figure 3 (Roc08 0000 04)

Figure 3 (Roc08 0000 04)
A line graph showing the relationship between dose number (x-axis, from 0 to 6) and time in minutes (y-axis, from 0 to 30). Two lines represent different doses: 0.1 mg/kg (N=29) and 0.15 mg/kg (N=13), with the higher dose showing generally longer times across dose numbers.*

* About these descriptions: Image descriptions on this page are generated by automated AI analysis of the product label images from the manufacturer's FDA label submission (SPL). They are provided for reference only and may contain errors or omissions. Always rely on the printed label itself and the official FDA labeling, and consult a pharmacist or healthcare professional with any questions about this product.