Dapagliflozin And Metformin Hydrochloride Tablet, Film Coated, Extended Release
Product Images NDC 84677-021

View Photos of Packaging, Regulatory Labels, and Product Appearance

Product Visual Gallery

This gallery contains 13 technical images submitted to the FDA as part of the official labeling for Dapagliflozin And Metformin Hydrochloride (NDC 84677-021). Unlike standard consumer photos, these assets often include clinical data figures, molecular chemical structures, and official manufacturer packaging layouts.

As provided by Golden State Medical Supply, Inc., these visuals offer a comprehensive scientific overview of the product's physical and chemical identity, aiding pharmacists and researchers in product verification and study.

FDA Label Image

84677-020-60ol- Dapa_met Tab 5_1000.jpg (84677 020 60ol Dapa Met Tab 5 1000)

84677-020-60ol- Dapa_met Tab 5_1000.jpg (84677 020 60ol  Dapa Met Tab 5 1000)
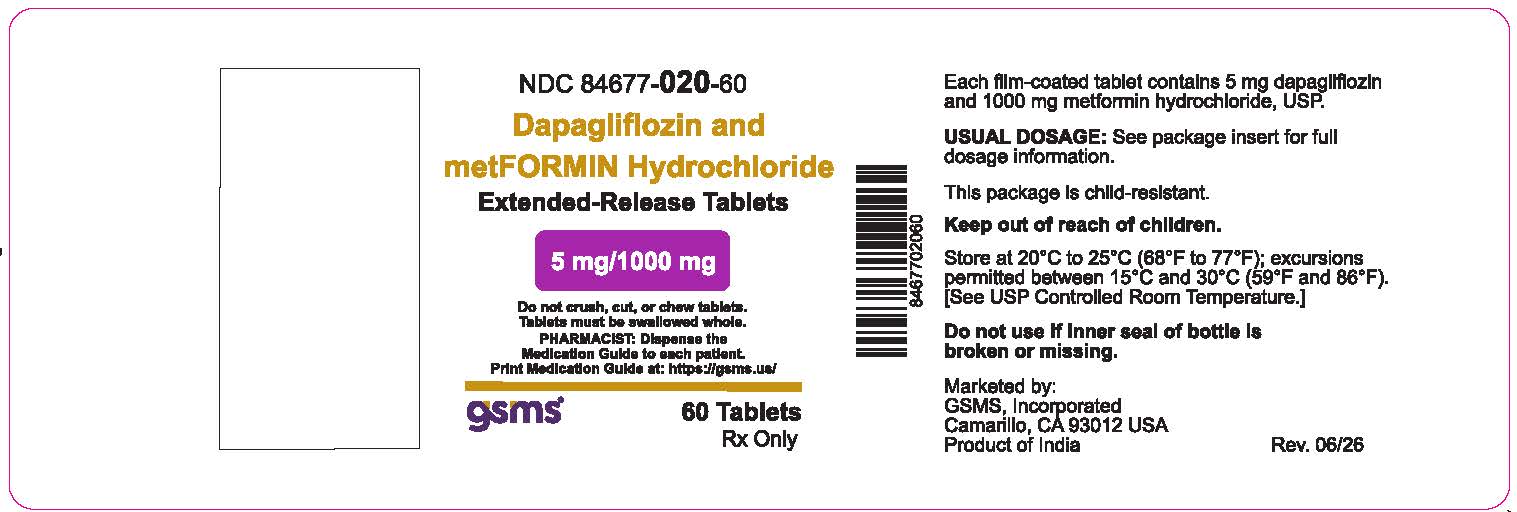
This text contains important information about a medication labeled as NDC 84677-020-60, which is Dapagliflozin and metformin Hydrochloride Extended-Release Tablets of strength 5 mg/1000 mg. It includes instructions not to crush, cut, or chew the tablets and emphasizes that they must be swallowed whole. The package contains 60 tablets and provides a website for printing the Medication Guide. The tablets are film-coated and the usual dosage information should be referred to in the package insert. It is child-resistant and should be kept out of reach of children. The storage temperature is recommended between 20°C to 25°C (68°F to 77°F) with excursions permitted between 15°C and 30°C (59°F and 86°F). The medication should not be used if the inner seal of the bottle is broken or missing. Additionally, it mentions the manufacturer as GS8MS, Incorporated located in Camarillo, CA, USA, with the product originating from India. The revision date is noted as 06/26.*
FDA Label Image

84677-021-30ol- Dapa_met Tab 10_500.jpg (84677 021 30ol Dapa Met Tab 10 500)

84677-021-30ol- Dapa_met Tab 10_500.jpg (84677 021 30ol  Dapa Met Tab 10 500)
This is a description of a medication with NDC 84677-021-30, which is a combination of dapagliflozin and metformin hydrochloride in extended-release tablets. It is important not to crush, cut, or chew the tablets, as they must be swallowed whole. The pharmacist should dispense the Medication Guide to each patient. Each film-coated tablet contains 10mg of dapagliflozin and 500mg of metformin hydrochloride. The usual dosage and storage instructions are provided in the package insert. The medication is child-resistant and should be kept out of reach of children. The product is marketed by GSMS, Incorporated in Carlsbad, CA, USA, and is a product of India.*
FDA Label Image

84677-022-30lb- Dapa_met Tab 10_1000.jpg (84677 022 30lb Dapa Met Tab 10 1000)

84677-022-30lb- Dapa_met Tab 10_1000.jpg (84677 022 30lb  Dapa Met Tab 10 1000)
Each filr ated tablet contains 10 mg dapaglifiozn and 1000 mg matormin hydrochioride, USP. This medication combines dapaglifiozin and matormin for extended-release tablets. The package is child-resistant. The tablets should be stored at 20°C to 25°C (68°F to 77°F), and between 16°C to 30°C (50°F to 86°F) is permitted. The product is manufactured by GSMS, Incorporated and is a prescription-only product from India. The full dosage information is provided on the packaging.*
FDA Label Image

Dapagliflozin Structural Formula (Dapagliflozin Structural Formula)

FDA Label Image

Figure 1 (Figure 1)

Figure 1 (Figure 1)
The text is: "CFB in 24-Hr Urinary Glucose (g)". This text refers to the change in fasting blood sugar level over a 24-hour period when monitoring urinary glucose levels. This information can be vital for assessing and managing conditions such as diabetes.*
FDA Label Image

Figure 2 (Figure 2)

Figure 2 (Figure 2)
This document provides information on the Adjusted Mean Change from Baseline HbA1c (%) for a study involving Dapagliflozin 10mg + Metformin XR, Dapagliflozin 10mg, and Metformin XR. The left side graph shows values for adjusted mean change from baseline using a longitudinal repeated measures model. It includes subjects who completed the study with both baseline and Week 24 HbA1c values without rescue. The right side graph for Week 24 (LOCF) displays values for adjusted mean change from baseline and 95% CIs using an ANCOVA model. It includes randomized subjects with a baseline and at least one post-baseline HbA1c value before rescue.*
FDA Label Image

Figure 4 (Figure 4)

Figure 4 (Figure 4)
This data appears to be related to a study or clinical trial involving Dapagliflozin and a placebo. The table shows the number of patients with an event at different time points and the number of patients at risk in each group. The data seems to be organized in time intervals ranging from 0 to 60.*
FDA Label Image

Figure 5 (Figure 5)

Figure 5 (Figure 5)
This appears to be a graph with data related to Dapagliflozin and Placebo treatments for patients over a certain time period. The x-axis likely represents months from randomization, while the y-axis could represent the number of patients at risk. The numbers in the chart seem to correspond to the number of patients at risk at different time points for both Dapagliflozin and Placebo groups.*
FDA Label Image

Figure 6 (Figure 6)

Figure 6 (Figure 6)
This is a comparison chart showing the results of Dapagliflozin versus Placebo. The Hazard Ratio (HR) is 0.61 with a 95% confidence interval of 0.51 to 0.72. The data is presented over a timeline of months from randomization, with the number of patients at risk decreasing over time for both groups.*
FDA Label Image

Figure 7a (Figure 7a)

Figure 7a (Figure 7a)
This is a statistical analysis table showing the comparison between Dapagliflozin and a placebo for patients with events. The Hazard Ratio (HR) is reported to be 0.74 with a 95% Confidence Interval (CI) of 0.65 to 0.85. The P-value is <0.0001, indicating a statistically significant difference. The table also includes the number of patients at risk over the course of 36 months from randomization for both treatment groups.*
FDA Label Image

Figure 7b (Figure 7b)

Figure 7b (Figure 7b)
This is a data table showing the results of a clinical trial comparing Dapagliflozin versus Placebo over a period of 36 months. The hazard ratio (HR) with a 95% confidence interval is reported as 0.82 (0.73, 0.92) with a significant P-value of 0.0008. The table also includes the number of patients at risk over the 36-month period, starting from randomization. The number of patients at risk decreases over time, highlighting the patient dropout rate or other factors.*
FDA Label Image

Figure 8 (Figure 8)

Figure 8 (Figure 8)
This text appears to be data from two different clinical trials, DAPA-HF and DELIVER, evaluating the effect of Dapagliflozin compared to placebo on heart failure patients with different left ventricular ejection fraction (LVEF) categories. The data includes the number of participants and the hazard ratio (HR) with 95% confidence intervals for each LVEF category. The results suggest that Dapagliflozin showed benefits compared to placebo in terms of decreasing risk for adverse outcomes in heart failure patients.*
FDA Label Image

Metformin HCl Structural Formula (Metformin HCl Structural Formula)

* These product label images have been analyzed using experimental machine learning. Please verify findings with the primary label text.