Tofacitinib Tablet, Film Coated
Product Images NDC 84677-055

View Photos of Packaging, Regulatory Labels, and Product Appearance

Product Visual Gallery

This gallery contains 10 technical images submitted to the FDA as part of the official labeling for Tofacitinib (NDC 84677-055). Unlike standard consumer photos, these assets often include clinical data figures, molecular chemical structures, and official manufacturer packaging layouts.

As provided by Golden State Medical Supply, Inc., these visuals offer a comprehensive scientific overview of the product's physical and chemical identity, aiding pharmacists and researchers in product verification and study.

FDA Label Image

84677-054-60 (Tofacitinib)
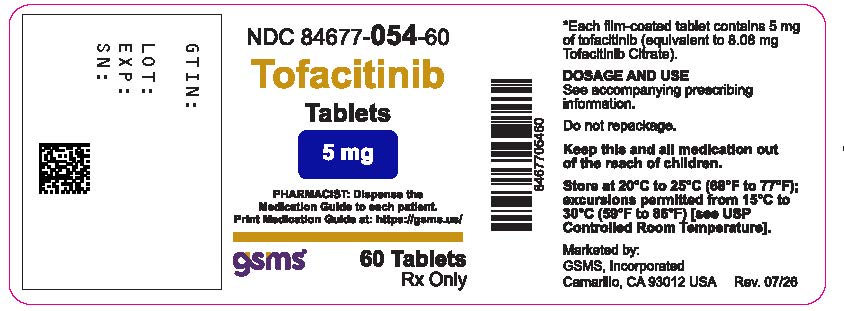
84677-054-60 (Tofacitinib)
Label for Tofacitinib tablets 5 mg by Golden State Medical Supply, Inc., containing 60 film-coated oral tablets. The label includes dosage strength, NDC number 84677-054-60, and storage instructions. It also advises to dispense the Medication Guide and keep medication out of children's reach.*
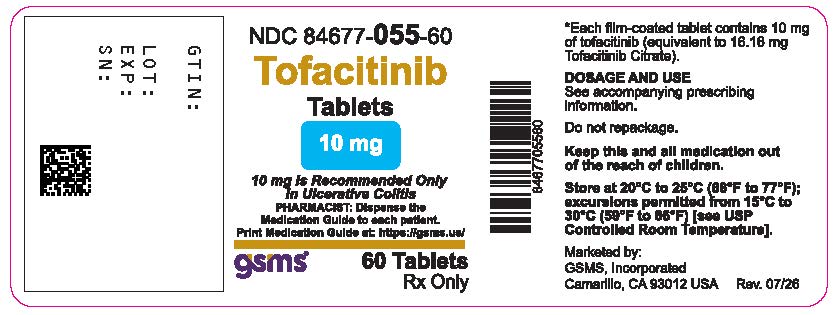
FDA Label Image

84677-055-60 (Tofacitinib)

84677-055-60 (Tofacitinib)
Label for Tofacitinib tablets 10 mg by Golden State Medical Supply, Inc. The film-coated tablets are packaged with 60 tablets per container. The label includes NDC number 84677-055-60 and storage instructions, along with a caution to keep medication out of the reach of children and not to repackage. The label references a medication guide for detailed prescribing information and usage.*
FDA Label Image

Figure1.jpg (Figure1)

Figure1.jpg (Figure1)
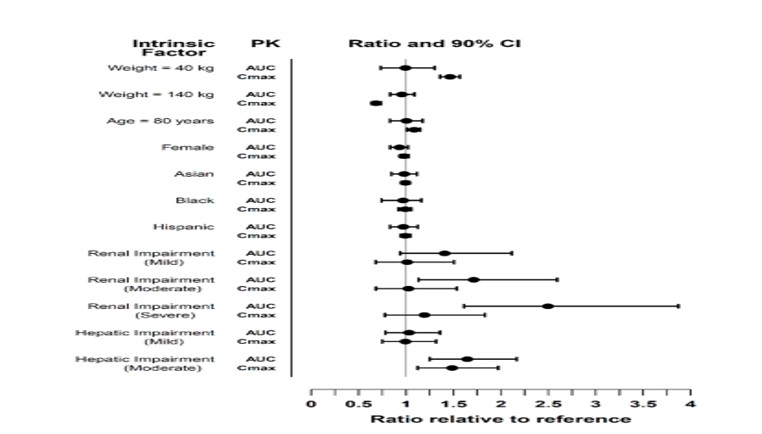
A forest plot chart showing pharmacokinetic (PK) ratios and 90% confidence intervals (CI) for the drug tofacitinib under various intrinsic factors such as weight, age, gender, race, and levels of renal and hepatic impairment. The chart compares area under the curve (AUC) and maximum concentration (Cmax) ratios relative to a reference for these different patient conditions.*
FDA Label Image

Figure2.jpg (Figure2)

Figure2.jpg (Figure2)
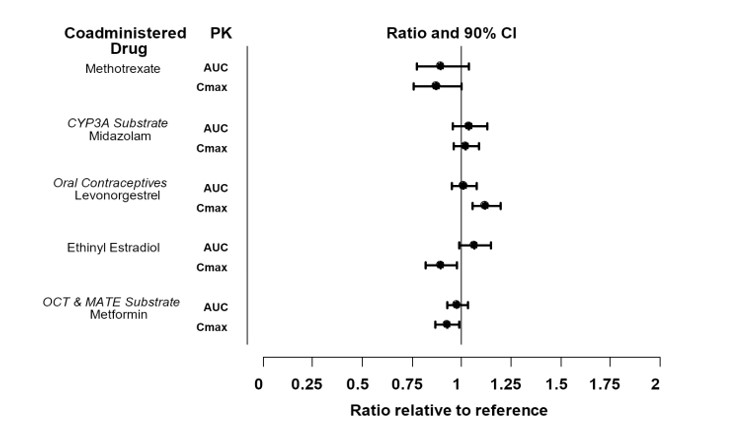
A pharmacokinetic (PK) graph showing the ratio and 90% confidence intervals for area under the curve (AUC) and peak concentration (Cmax) comparing tofacitinib coadministered with various drugs: Methotrexate, Midazolam, Levonorgestrel, Ethinyl Estradiol, and Metformin. The x-axis presents the ratio relative to reference from 0 to 2.*
FDA Label Image

Figure3.jpg (Figure3)

Figure3.jpg (Figure3)
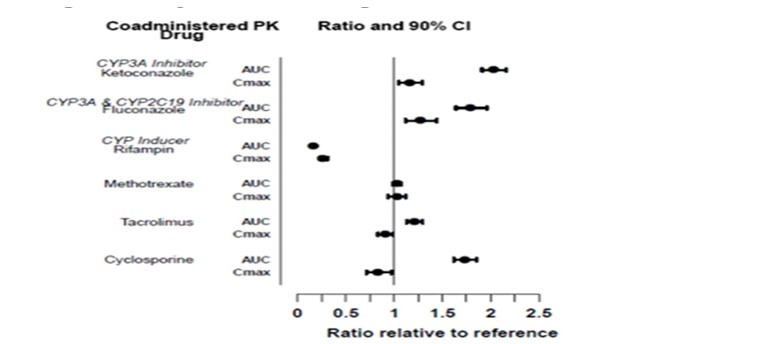
A pharmacokinetic (PK) chart showing the ratio and 90% confidence interval (CI) for area under the curve (AUC) and maximum concentration (Cmax) values of Tofacitinib coadministered with various drugs, including ketoconazole, fluconazole, rifampin, methotrexate, tacrolimus, and cyclosporine. The x-axis represents the ratio relative to reference from 0 to 2.5.*
FDA Label Image

Figure4.jpg (Figure4)

Figure4.jpg (Figure4)
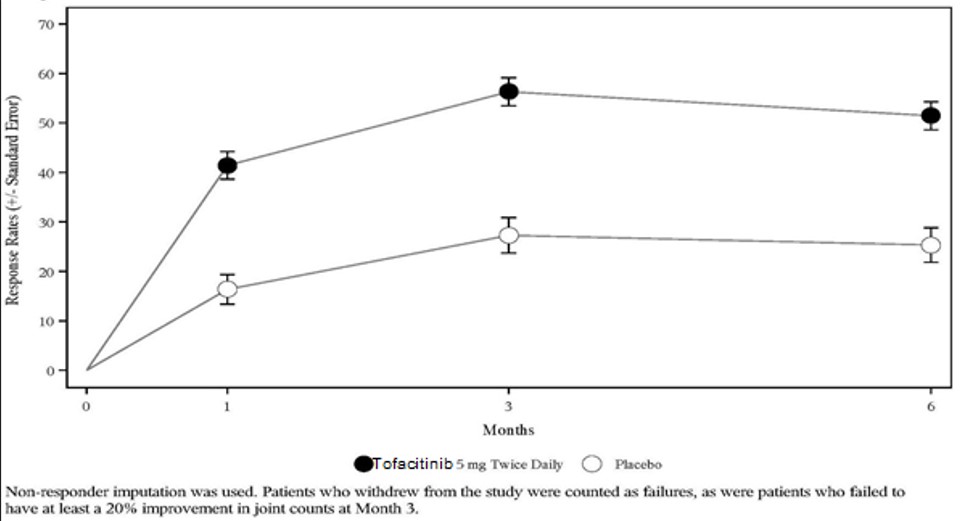
A line graph showing response rates with standard error bars for Tofacitinib 5 mg twice daily compared to placebo over a 6-month period. The x-axis represents months (0, 1, 3, 6) and the y-axis shows response rates with standard error. Tofacitinib demonstrates higher response rates than placebo throughout the timeframe, as indicated by solid and open circles respectively.*
FDA Label Image

Figure5.jpg (Figure5)

Figure5.jpg (Figure5)
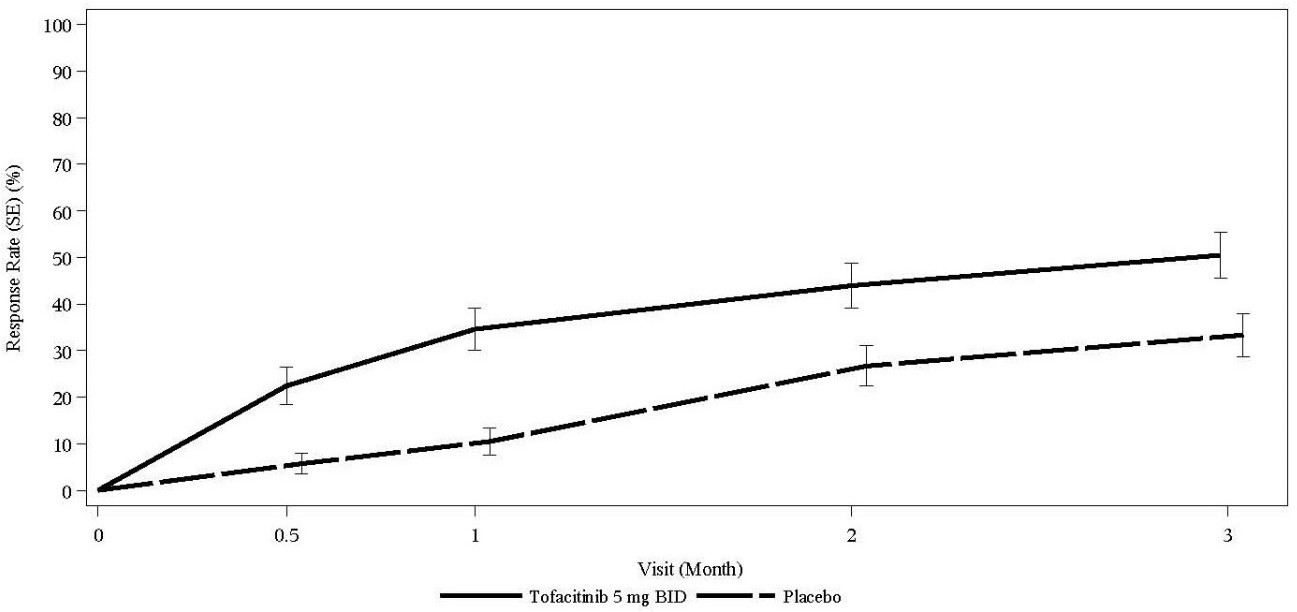
A line graph comparing the response rate (%) over 3 months between Tofacitinib 5 mg BID and placebo. The x-axis represents visit months from 0 to 3, and the y-axis shows response rate with standard error bars. Tofacitinib shows a higher increasing response rate than placebo throughout the period.*
FDA Label Image

Figure6.jpg (Figure6)

Figure6.jpg (Figure6)
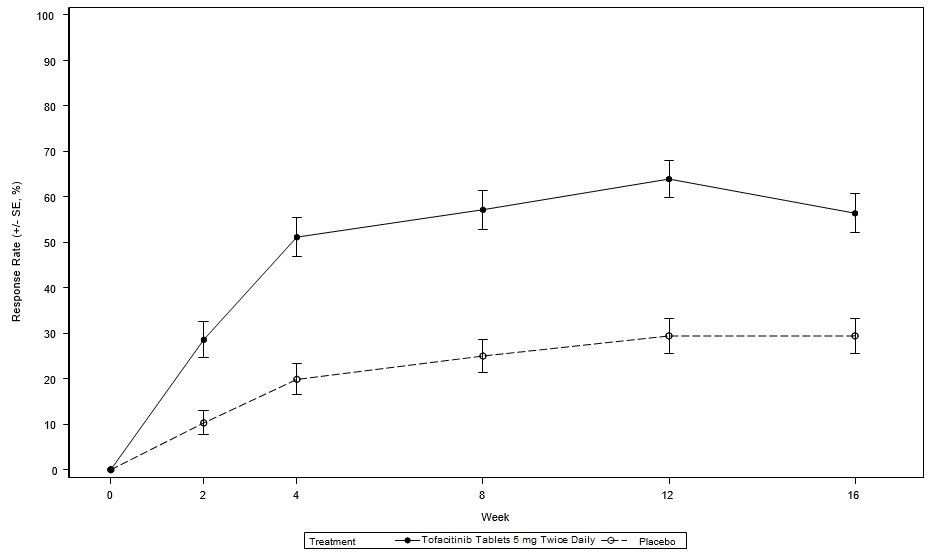
A line graph showing response rate percentages over 16 weeks comparing Tofacitinib Tablets 5 mg twice daily and placebo. The x-axis represents weeks (0 to 16) and the y-axis represents response rate (%). The graph includes error bars for standard error, demonstrating higher response rates for Tofacitinib compared to placebo at all measured time points.*
FDA Label Image

Figure7.jpg (Figure7)

Figure7.jpg (Figure7)
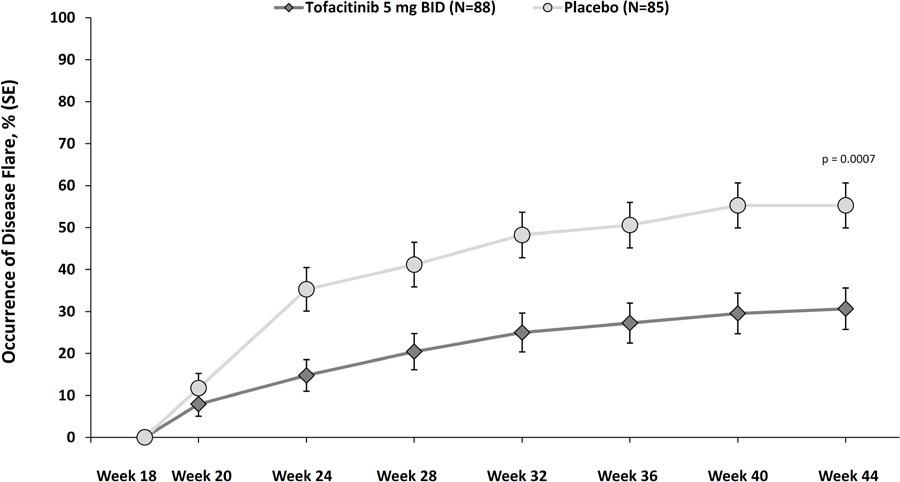
A line graph depicting the occurrence of disease flare percentages over time from Week 18 to Week 44. The graph compares Tofacitinib 5 mg BID (twice daily) and Placebo groups, showing lower disease flare occurrence in the Tofacitinib group throughout the timeline. The plot includes standard error bars and a noted p-value of 0.0007 indicating statistical significance at Week 44.*
FDA Label Image

Structure.jpg (Structure)

Structure.jpg (Structure)
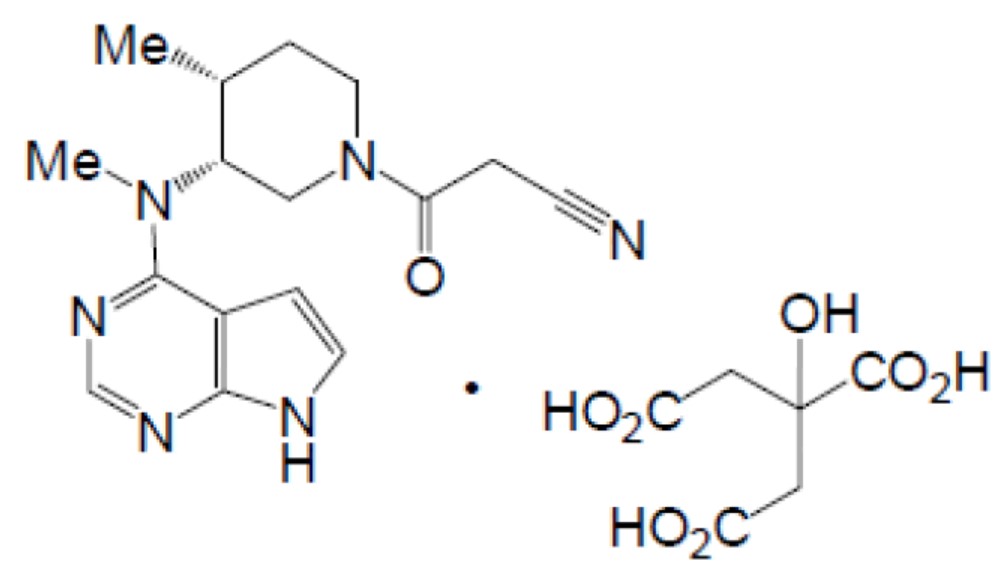
Chemical structure of tofacitinib, depicting its molecular configuration with nitrogen-containing rings and several functional groups. The structure includes a representation of an associated molecule, likely a counterion or salt form, shown with carboxyl and hydroxyl groups.*

* About these descriptions: Image descriptions on this page are generated by automated AI analysis of the product label images from the manufacturer's FDA label submission (SPL). They are provided for reference only and may contain errors or omissions. Always rely on the printed label itself and the official FDA labeling, and consult a pharmacist or healthcare professional with any questions about this product.