Ahzantive Injection, Solution
Product Images NDC 85006-2908

View Photos of Packaging, Regulatory Labels, and Product Appearance

Product Visual Gallery

This gallery contains 16 technical images submitted to the FDA as part of the official labeling for Ahzantive (NDC 85006-2908). Unlike standard consumer photos, these assets often include clinical data figures, molecular chemical structures, and official manufacturer packaging layouts.

As provided by Valorum Biologics, Llc, these visuals offer a comprehensive scientific overview of the product's physical and chemical identity, aiding pharmacists and researchers in product verification and study.

FDA Label Image

Carton (Carton Label)
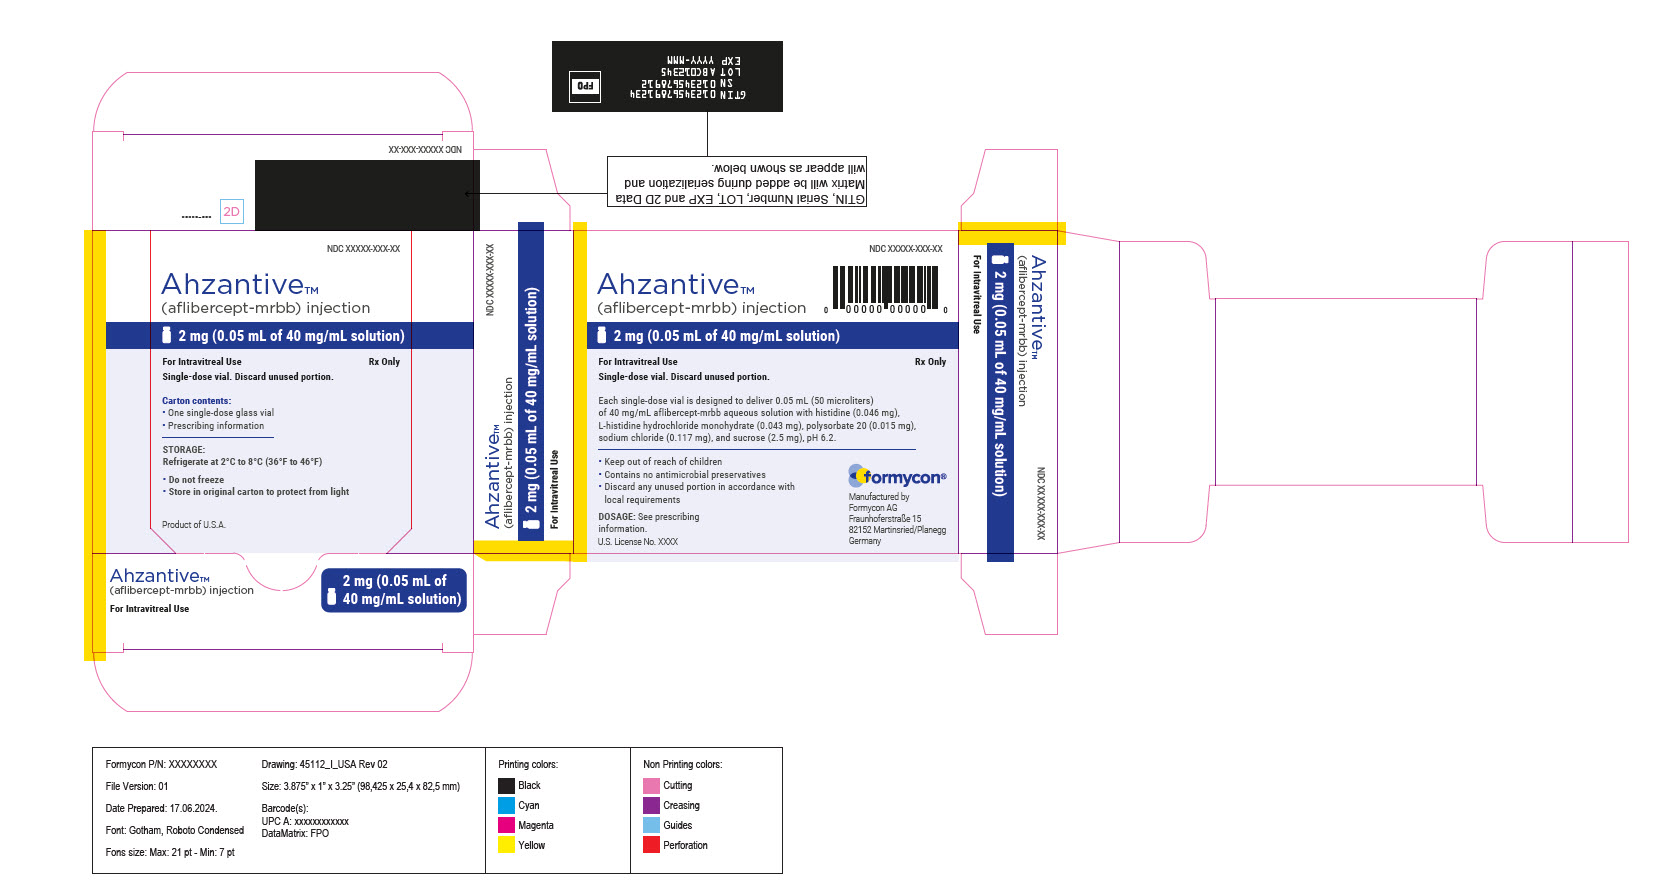
Carton (Carton Label)
Packaging label for Ahzantive 2 mg (0.05 mL of 40 mg/mL solution) injection, intravitreal use. The label indicates it is single-dose, Rx only, and includes storage instructions to refrigerate at 2°C to 8°C and not freeze. The product is manufactured by Formycon AG, Germany, and labeled for Valorum Biologics, LLC. The design includes dosage details, warnings to keep out of reach of children and mentions no antimicrobial preservatives.*
FDA Label Image

Vial Label (Vial Label)

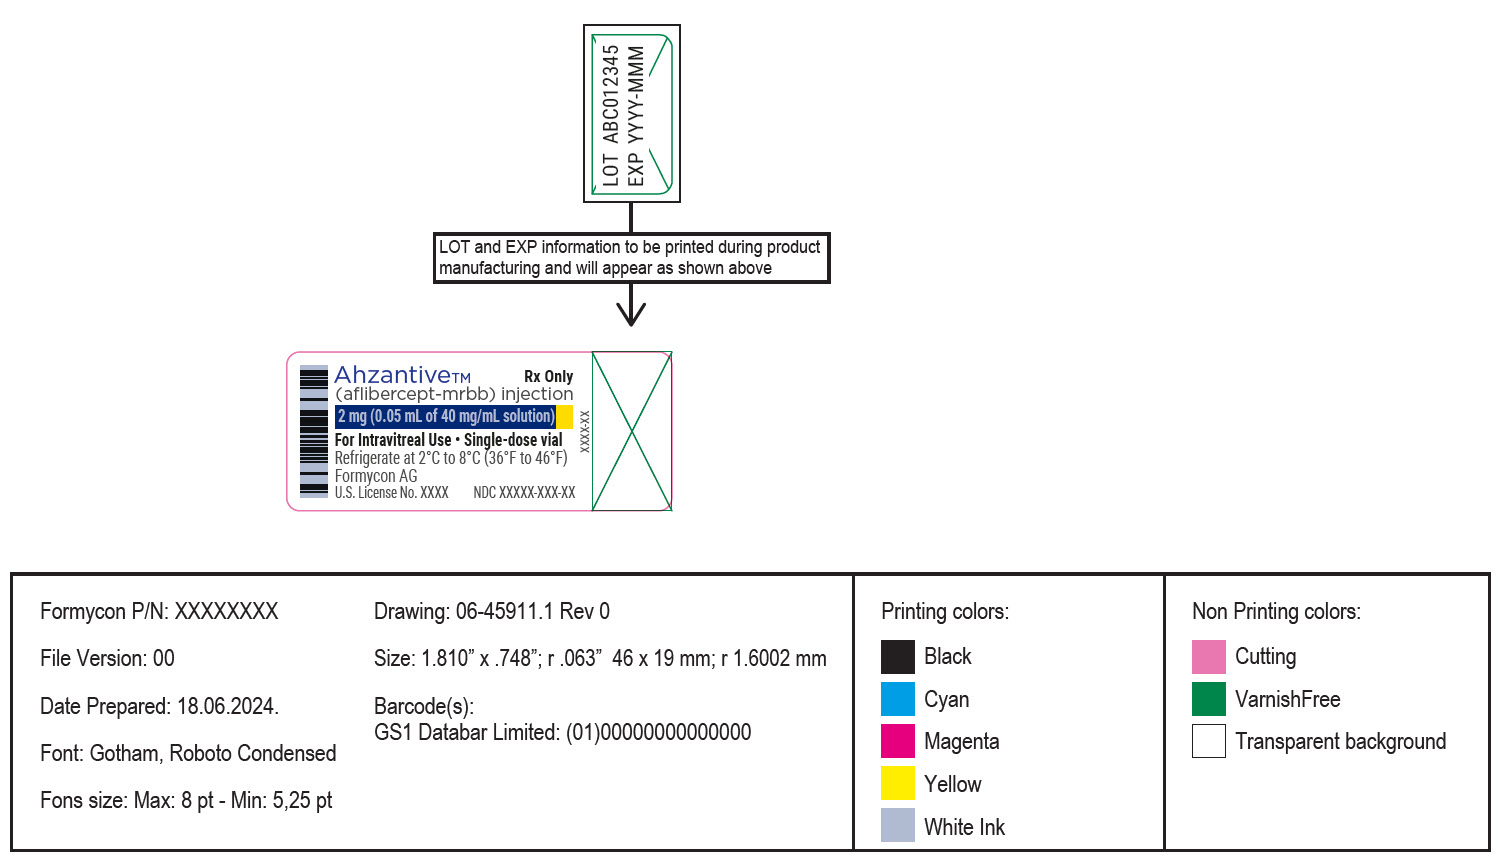
Vial Label (Vial Label)
The image shows a label for AHZANTIVE (aflibercept-mrbb) injection, highlighting a single-dose vial with a concentration of 2 mg in 0.05 mL of 40 mg/mL solution. It specifies intravitreal use and refrigeration storage at 2°C to 8°C. The label references Formycon AG and includes typical manufacturing lot and expiration details.*
FDA Label Image

Figure 2 (Ahzantive 02)

Figure 2 (Ahzantive 02)
An instructional line drawing showing two hands handling a small vial, likely demonstrating how to prepare or open the vial cap, consistent with a medication injection vial.*
FDA Label Image

Figure 3 (Ahzantive 03)

Figure 3 (Ahzantive 03)
An instructional illustration showing hands assembling a syringe by inserting or attaching a component, indicated by directional arrows. The image depicts the process of preparing an injection device, relevant for intravitreal injection procedures.*
FDA Label Image

Figure 4a (Ahzantive 04)

Figure 4a (Ahzantive 04)
An instructional black-and-white line drawing showing two hands preparing a syringe by drawing liquid from a vial. One hand holds the vial upside down while the other hand pulls back the plunger on the syringe.*
FDA Label Image

Figure 4b (Ahzantive 05)

Figure 4b (Ahzantive 05)
An instructional diagram showing a syringe drawing solution from a vial for injection. The close-up highlights the syringe needle with the needle bevel pointing down into the solution. This illustration relates to proper preparation technique for AHZANTIVE injection.*
FDA Label Image

Figure 5 (Ahzantive 06)

Figure 5 (Ahzantive 06)
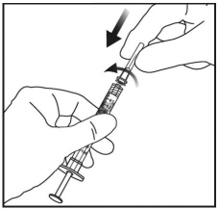
An instructional diagram depicting two hands preparing a syringe for injection. One hand holds the syringe barrel, while the other hand removes a protective cap or cover from the needle, indicated by arrows. The illustration suggests preparation steps for intravitreal injection administration.*
FDA Label Image

Figure 6 (Ahzantive 07)

Figure 6 (Ahzantive 07)
An instructional line-art illustration showing hands holding and preparing a syringe for an injection. The image emphasizes correct finger positioning and handling technique, likely for intravitreal administration.*
FDA Label Image

Figure 7a (Ahzantive 08)

Figure 7a (Ahzantive 08)
An instructional illustration showing a syringe with a liquid marked at the 0.1 mL level. A thick black arrow points to the 0.1 mL mark, indicating the correct dosage volume to be drawn into the syringe.*
FDA Label Image

Figure 7b (Ahzantive 09)

Figure 7b (Ahzantive 09)
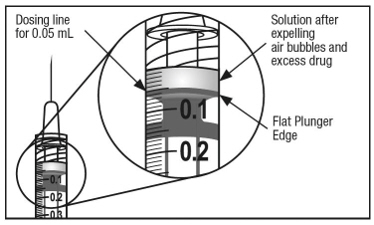
An instructional diagram showing a syringe with a close-up view of the dosing line for 0.05 mL, highlighting the flat plunger edge and indicating the solution level after expelling air bubbles and excess drug. The syringe markings 0.1 and 0.2 mL are visible in the close-up.*
FDA Label Image

Figure 8 (Ahzantive 10)

Figure 8 (Ahzantive 10)
Two line graphs displaying mean change in visual acuity (letters) over 96 weeks for different aflibercept and ranibizumab dosing regimens. The top graph (VIEW 1) and bottom graph (VIEW 2) compare aflibercept 2 mg every 8 weeks, aflibercept 2 mg every 4 weeks, and ranibizumab 0.5 mg every 4 weeks with mean letter changes labeled near week 52.*
FDA Label Image

Figure 9 (Ahzantive 11)

Figure 9 (Ahzantive 11)
A set of two line graphs titled COPERNICUS and GALILEO showing mean change in visual acuity (letters) over 24 weeks. Both graphs compare aflibercept 2 mg administered every 4 weeks (triangles) and a control group (circles). Visual acuity improved in the aflibercept groups while it decreased or remained stable in control groups.*
FDA Label Image

Figure 10 (Ahzantive 12)

Figure 10 (Ahzantive 12)
Line graph titled "VIBRANT" showing mean change in visual acuity (letters) over 24 weeks. The x-axis represents weeks from 0 to 24, and the y-axis represents mean change in visual acuity from 0 to 20 letters. Two data series are plotted: one for aflibercept 2 mg every 4 weeks, depicted with triangles and a dashed line, showing an increasing trend reaching +17 letters at 24 weeks; the other for a control group, depicted with circles and a dashed line, showing a slower increase up to +6.9 letters at 24 weeks.*
FDA Label Image

Figure 11 (Ahzantive 13)

Figure 11 (Ahzantive 13)
Two line graphs showing mean change in visual acuity (letters) over 100 weeks for two studies, VIVID and VISTA, comparing aflibercept 2 mg dosing every 8 weeks and every 4 weeks to a control group. The graphs plot visual acuity improvements with aflibercept regimens significantly higher than control at various time points, with markers indicating data at week 52.*
FDA Label Image

Figure 12 (Ahzantive 14)

Figure 12 (Ahzantive 14)
A bar chart comparing the proportion of patients over time between Control (Sham), Aflibercept 2016, and Aflibercept 208 groups at weeks 8, 12, 24, 40, and 52. The vertical axis represents the proportion of patients, and the horizontal axis shows the weeks of measurement.*
FDA Label Image

Figure 1 (Correct Ahzantive Fig07 3)

Figure 1 (Correct Ahzantive Fig07 3)
An instructional line drawing showing two hands holding a small vial. One hand is grasping the vial while the other is removing a flip-off cap from the vial top. The vial appears to contain a solution for injection.*

* About these descriptions: Image descriptions on this page are generated by automated AI analysis of the product label images from the manufacturer's FDA label submission (SPL). They are provided for reference only and may contain errors or omissions. Always rely on the printed label itself and the official FDA labeling, and consult a pharmacist or healthcare professional with any questions about this product.