Diclofenac Epolamine System
Product Images NDC 85509-1405

View Photos of Packaging, Regulatory Labels, and Product Appearance

Product Visual Gallery

This gallery contains 6 technical images submitted to the FDA as part of the official labeling for Diclofenac Epolamine (NDC 85509-1405). Unlike standard consumer photos, these assets often include clinical data figures, molecular chemical structures, and official manufacturer packaging layouts.

As provided by Phoenix Rx Llc, these visuals offer a comprehensive scientific overview of the product's physical and chemical identity, aiding pharmacists and researchers in product verification and study.

FDA Label Image

Image (Image)

Image (Image)
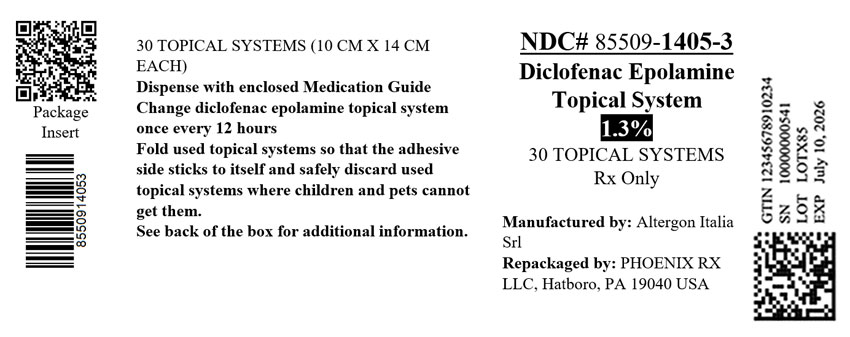
Label for Diclofenac Epolamine Topical System 1.3%, a prescription topical system. The package contains 30 topical systems measuring 10 cm by 14 cm each. Manufactured by Altergon Italia Srl and repackaged by Phoenix RX LLC, Hatboro, PA. The label includes instructions for use and disposal, barcode, and NDC number 85509-1405-3.*
FDA Label Image

Chemical Structure (Diclofenac 01)

Chemical Structure (Diclofenac 01)
Chemical structure diagram of Diclofenac Epolamine showing the molecular components of Diclofenac and Epolamine with their respective chemical groups and bonds.*
FDA Label Image

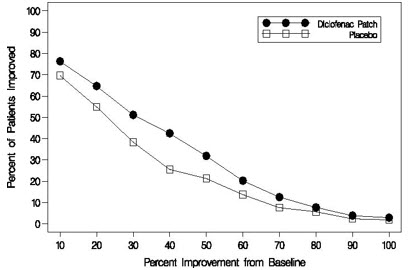
Figure 1 (Diclofenac 02)

Figure 1 (Diclofenac 02)
A line graph comparing percent improvement from baseline on the x-axis to percent of patients improved on the y-axis. It features two lines, one for Diclofenac Patch and one for Placebo, indicating the percentage of patients improved relative to the level of improvement from baseline.*
FDA Label Image

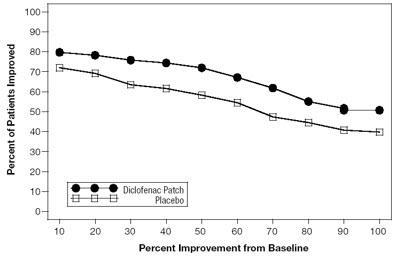
Figure 2 (Diclofenac 03)

Figure 2 (Diclofenac 03)
A line graph comparing percent improvement from baseline to percent of patients improved for Diclofenac Patch and Placebo. The x-axis represents percent improvement from baseline (10 to 100%), and the y-axis represents percent of patients improved (10 to 100%). Two lines are shown: one with circles for Diclofenac Patch and one with squares for Placebo.*
FDA Label Image

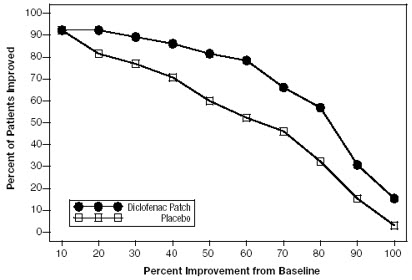
Figure 3 (Diclofenac 04)

Figure 3 (Diclofenac 04)
A line graph comparing the percentage of patients improved against percent improvement from baseline for Diclofenac Patch and placebo. The graph features two lines: one with filled circles representing Diclofenac Patch showing higher improvement, and one with open squares representing placebo showing lower improvement overall.*
FDA Label Image

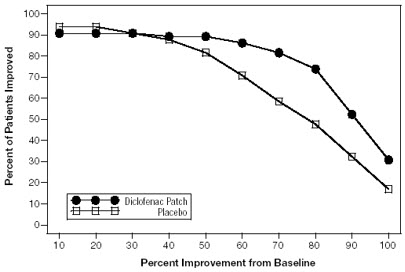
Figure 4 (Diclofenac 05)

Figure 4 (Diclofenac 05)
A line graph comparing the percent of patients improved versus percent improvement from baseline between Diclofenac Patch and placebo. The graph shows two curves, with the Diclofenac Patch group demonstrating a higher percent of patient improvement across increasing percent improvement values compared to placebo.*

* About these descriptions: Image descriptions on this page are generated by automated AI analysis of the product label images from the manufacturer's FDA label submission (SPL). They are provided for reference only and may contain errors or omissions. Always rely on the printed label itself and the official FDA labeling, and consult a pharmacist or healthcare professional with any questions about this product.