Fluticasone Propionate Powder, Metered
Product Images NDC 85766-235

View Photos of Packaging, Regulatory Labels, and Product Appearance

Product Visual Gallery

This gallery contains 16 technical images submitted to the FDA as part of the official labeling for Fluticasone Propionate (NDC 85766-235). Unlike standard consumer photos, these assets often include clinical data figures, molecular chemical structures, and official manufacturer packaging layouts.

As provided by Sportpharm Llc, these visuals offer a comprehensive scientific overview of the product's physical and chemical identity, aiding pharmacists and researchers in product verification and study.

FDA Label Image

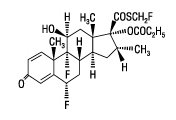
Fluticasone Propionate Chemical Structure (Fluticasone Propionate Diskus Spl Graphic 01)
FDA Label Image

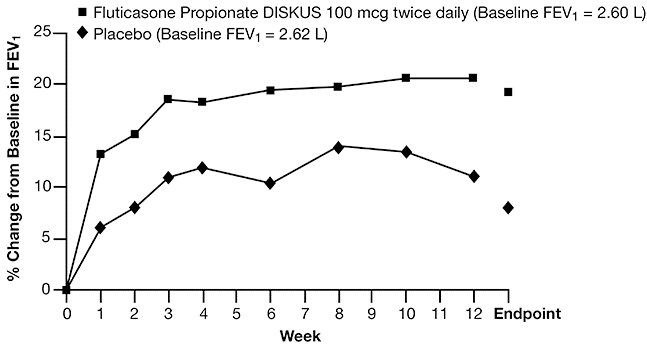
Figure 1 (Fluticasone Propionate Diskus Spl Graphic 02)

Figure 1 (Fluticasone Propionate Diskus Spl Graphic 02)
This text contains information regarding a study comparing the effects of Fluticasone Propionate DISKUS 100 mcg twice daily and a placebo on FEV (Forced Expiratory Volume). The baseline FEV values are provided as 2.60 L for Fluticasone Propionate DISKUS and 2.62 L for the placebo group. The table shows the % change from baseline in FEV at different time points up to the endpoint of the study. The data provides insights into the respiratory effects of the medications being evaluated.*
FDA Label Image

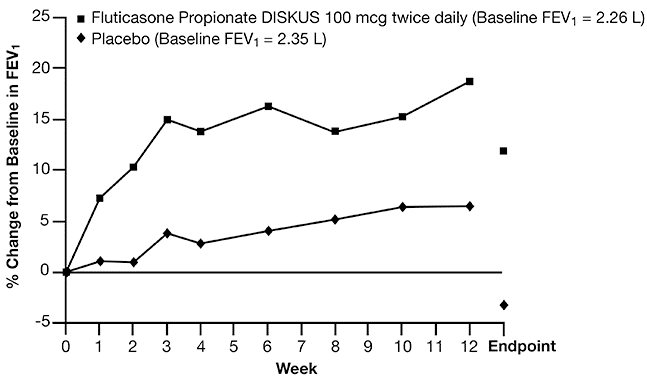
Figure 2 (Fluticasone Propionate Diskus Spl Graphic 03)

Figure 2 (Fluticasone Propionate Diskus Spl Graphic 03)
This text contains information about the use of Fluticasone Propionate DISKUS at a dosage of 100 mcg twice daily compared to a placebo in relation to Baseline FEV. The data seems to involve a % change analysis from baseline.*
FDA Label Image

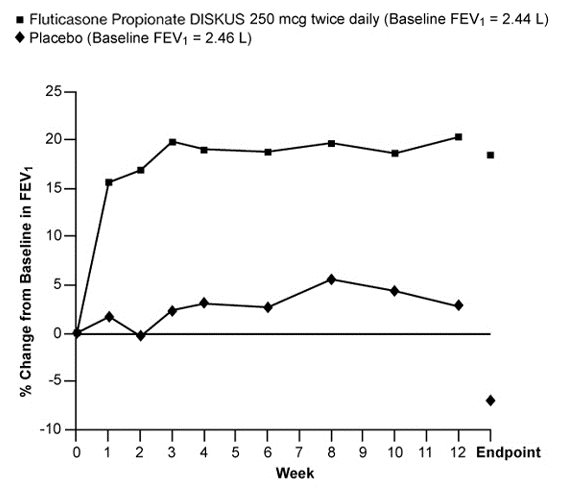
Figure 3 (Fluticasone Propionate Diskus Spl Graphic 04)

Figure 3 (Fluticasone Propionate Diskus Spl Graphic 04)
This is a comparison chart showing the effects of Fluticasone Propionate DISKUS 250 mcg twice daily and Placebo on FEV (Forced Expiratory Volume) measurements over a period of time. The baseline FEV values for both treatments were 2.44 L and 2.46 L, respectively. The chart displays the percentage change from baseline in FEV at different time points up to the endpoint.*
FDA Label Image

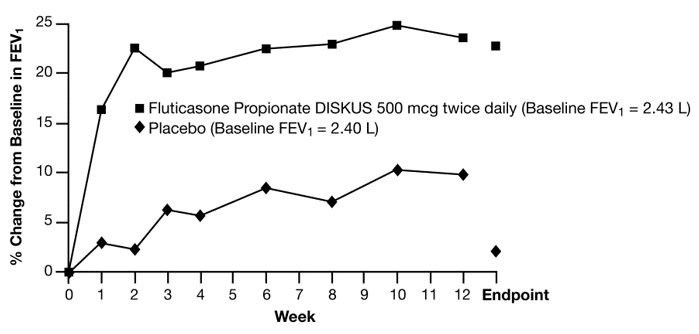
Figure 4 (Fluticasone Propionate Diskus Spl Graphic 05)

Figure 4 (Fluticasone Propionate Diskus Spl Graphic 05)
This text provides information about a clinical study comparing the effectiveness of Fluticasone Propionate Diskus 500mcg twice daily versus a placebo. The study measures the % change from baseline in FEV (Forced Expiratory Volume) over the course of the study.*
FDA Label Image

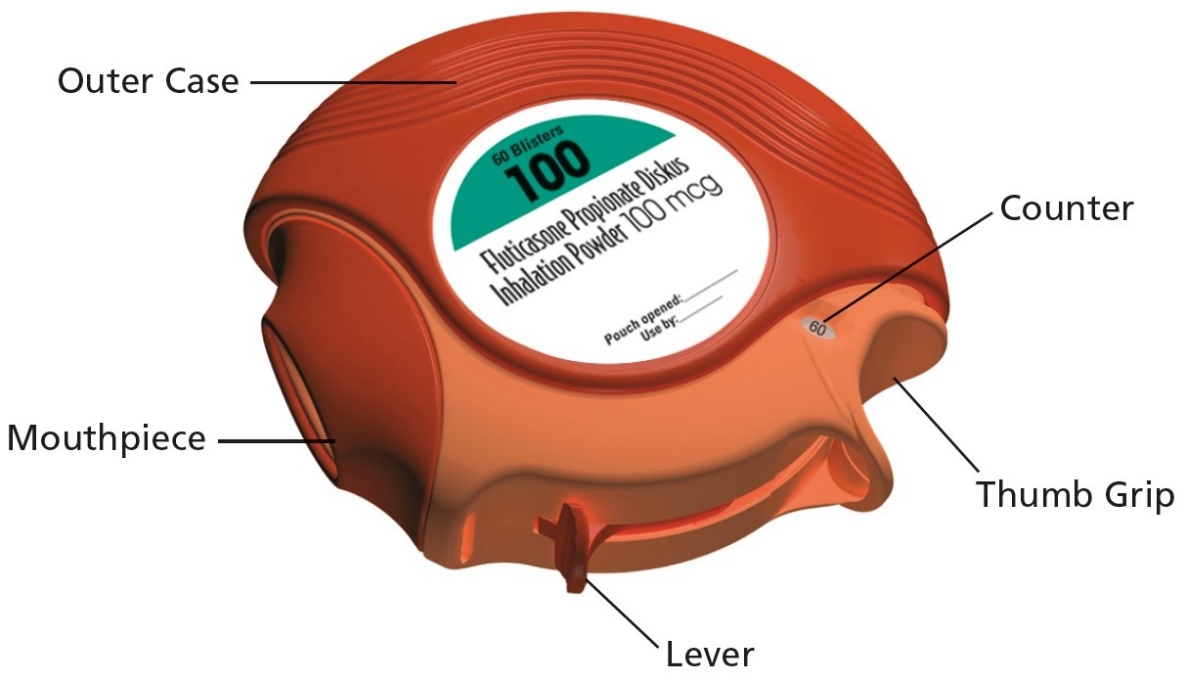
Figure A (Fluticasone Propionate Diskus Spl Graphic 06)

Figure A (Fluticasone Propionate Diskus Spl Graphic 06)
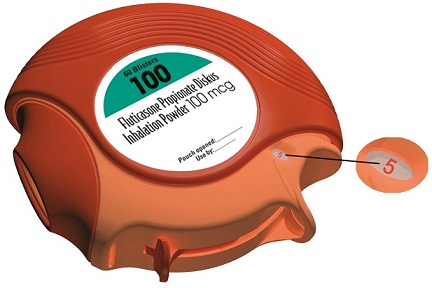
This text appears to list different parts of an item, possibly a tool or a device. The parts mentioned are "Outer Case," "Counter," "Mouthpiece," "Thumb Grip," and "Lever." The list may be describing a product's components or detailing the functions of each part.*
FDA Label Image

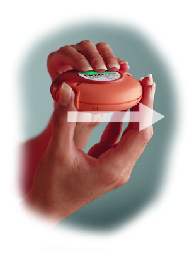
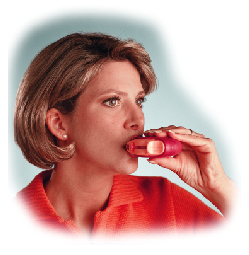
Figure B (Fluticasone Propionate Diskus Spl Graphic 07)

FDA Label Image

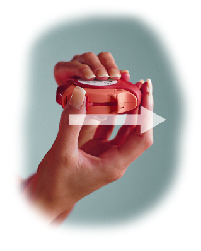
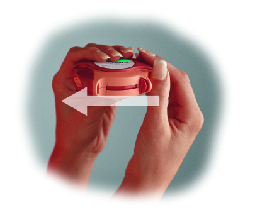
Figure C (Fluticasone Propionate Diskus Spl Graphic 08)

FDA Label Image

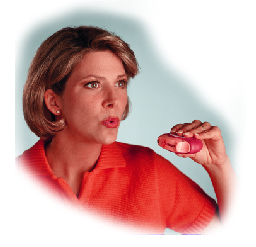
Figure D (Fluticasone Propionate Diskus Spl Graphic 09)

FDA Label Image

Figure E (Fluticasone Propionate Diskus Spl Graphic 10)

FDA Label Image

Figure F (Fluticasone Propionate Diskus Spl Graphic 11)

FDA Label Image

Figure G (Fluticasone Propionate Diskus Spl Graphic 12)

FDA Label Image

Figure H (Fluticasone Propionate Diskus Spl Graphic 13)

FDA Label Image

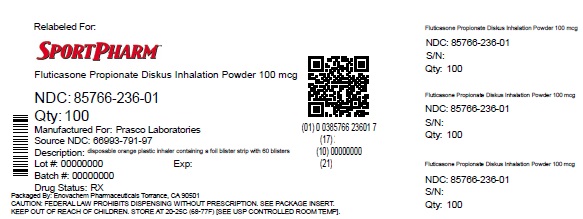
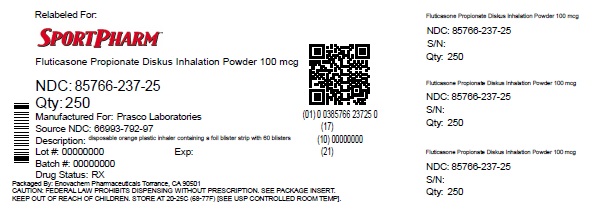
100 (Label 100mcg)

FDA Label Image

250 (Label 250mcg)

FDA Label Image

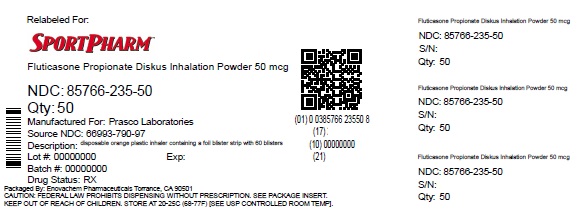
50 (Label 50mcg)

* These product label images have been analyzed using experimental machine learning. Please verify findings with the primary label text.