Lucemyra Tablet, Film Coated
Product Images NDC 85789-801

View Photos of Packaging, Regulatory Labels, and Product Appearance

Product Visual Gallery

This gallery contains 7 technical images submitted to the FDA as part of the official labeling for Lucemyra (NDC 85789-801). Unlike standard consumer photos, these assets often include clinical data figures, molecular chemical structures, and official manufacturer packaging layouts.

As provided by Biocorrx Pharmaceuticals Inc, these visuals offer a comprehensive scientific overview of the product's physical and chemical identity, aiding pharmacists and researchers in product verification and study.

FDA Label Image

Bottle Label (Bottlelabel)
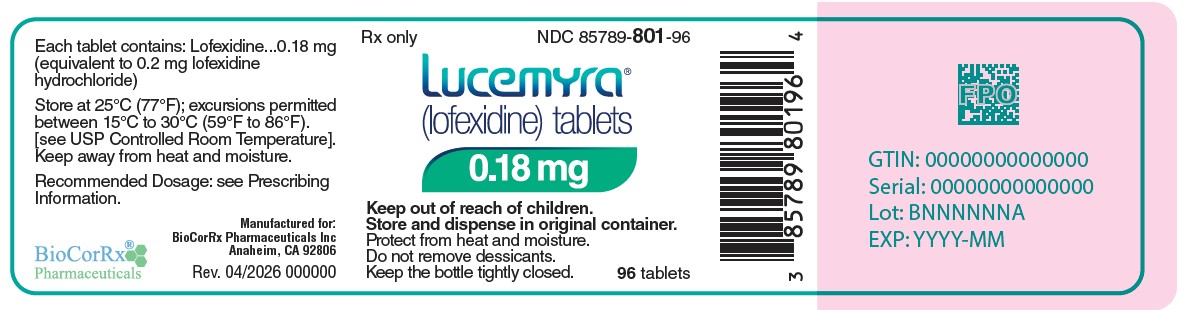
Bottle Label (Bottlelabel)
Packaging label for LUCEMYRA (lofexidine) tablets, 0.18 mg film-coated oral tablets. The label includes storage instructions, dosage form, and manufacturer information. It notes 96 tablets per bottle and includes a barcode, GTIN, serial number, lot, and expiration placeholders. The labeler is BioCorRx Pharmaceuticals Inc.*
FDA Label Image

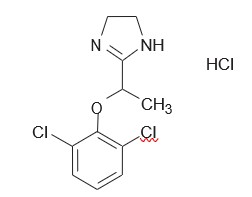
Chemical Structure (Chemicalstructure)

Chemical Structure (Chemicalstructure)
Chemical structure of lofexidine hydrochloride showing the molecular arrangement including a pyrazole ring, chlorinated benzene ring, and hydrochloride component.*
FDA Label Image

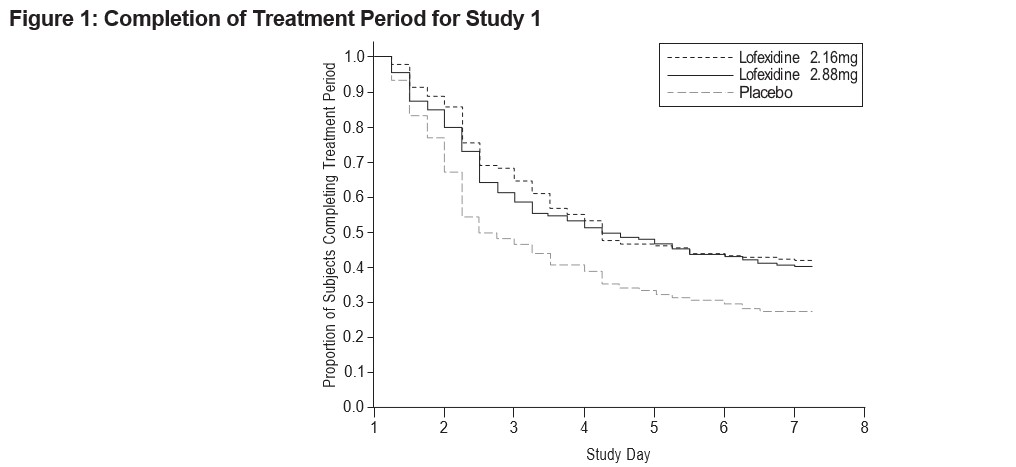
Figure 1 (Figure1)

Figure 1 (Figure1)
A line graph titled 'Completion of Treatment Period for Study 1' showing the proportion of subjects completing treatment over study days 1 to 8. It compares three groups: Lofexidine 2.16 mg, Lofexidine 2.88 mg, and Placebo, illustrating treatment completion rates over time.*
FDA Label Image

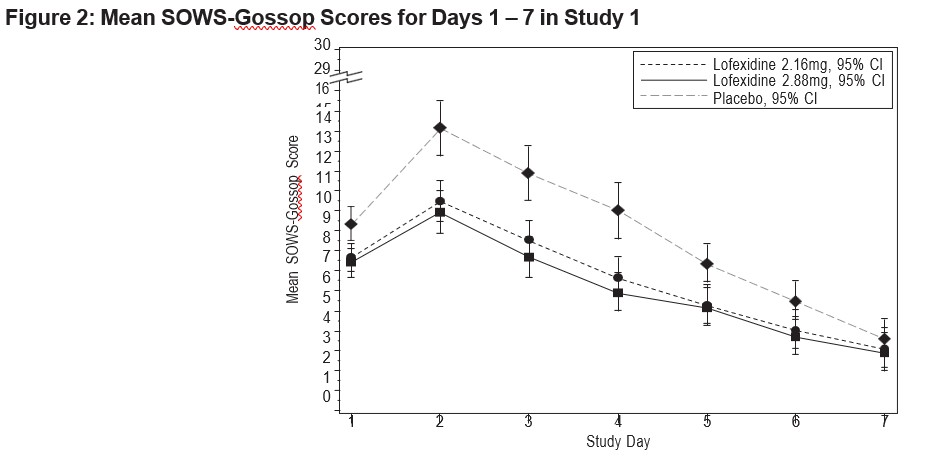
Figure 2 (Figure2)

Figure 2 (Figure2)
A line chart titled 'Mean SOWS-Gossop Scores for Days 1–7 in Study 1' showing the mean score on the vertical axis and study days 1 through 7 on the horizontal axis. Three lines represent treatments: Lofexidine 2.16 mg, Lofexidine 2.88 mg, and placebo, each with 95% confidence intervals. The chart tracks score changes over the 7-day study period.*
FDA Label Image

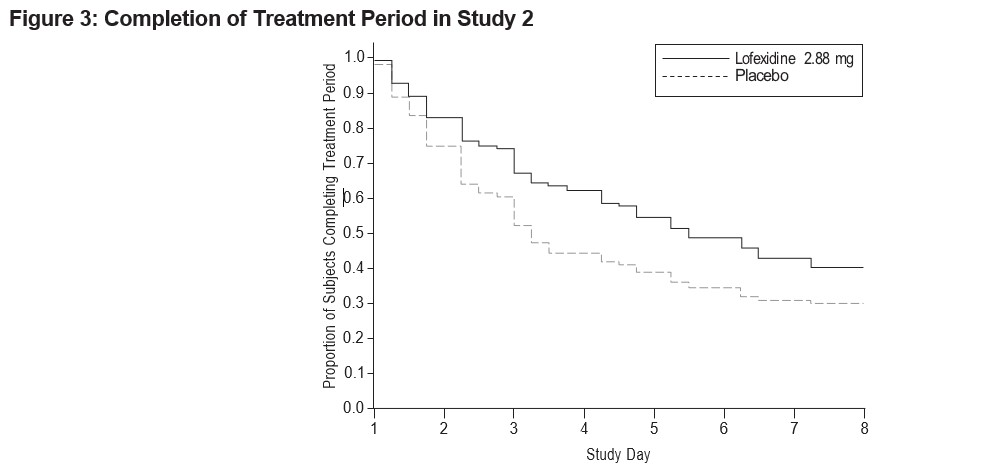
Figure 3 (Figure3)

Figure 3 (Figure3)
A Kaplan-Meier plot titled 'Completion of Treatment Period in Study 2' comparing the proportion of subjects completing treatment over 8 study days. The graph shows two lines: one solid line for lofexidine 2.88 mg and one dashed line for placebo, with the vertical axis representing the proportion of subjects completing treatment from 0 to 1, and the horizontal axis showing study days from 1 to 8.*
FDA Label Image

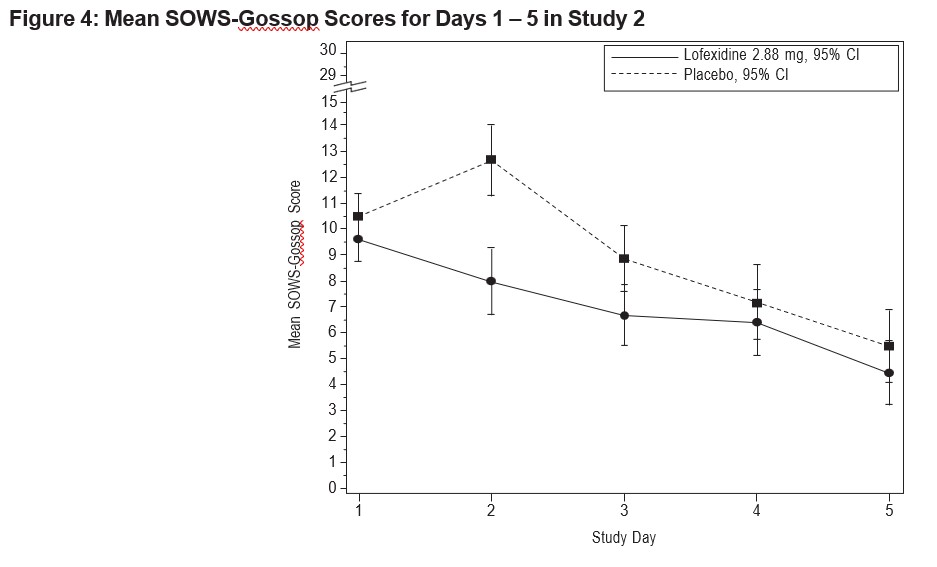
Figure 4 (Figure4)

Figure 4 (Figure4)
A line graph showing mean SOWS-Gossop scores over five study days comparing Lofexidine 2.88 mg with placebo. The solid line represents Lofexidine with a decreasing trend in scores, while the dashed line shows placebo scores, which are higher overall. Error bars indicate 95% confidence intervals for each data point.*
FDA Label Image

* About these descriptions: Image descriptions on this page are generated by automated AI analysis of the product label images from the manufacturer's FDA label submission (SPL). They are provided for reference only and may contain errors or omissions. Always rely on the printed label itself and the official FDA labeling, and consult a pharmacist or healthcare professional with any questions about this product.