Levetiracetam Injection, Solution, Concentrate
Product Images NDC 85957-037

View Photos of Packaging, Regulatory Labels, and Product Appearance

Product Visual Gallery

This gallery contains 12 technical images submitted to the FDA as part of the official labeling for Levetiracetam (NDC 85957-037). Unlike standard consumer photos, these assets often include clinical data figures, molecular chemical structures, and official manufacturer packaging layouts.

As provided by Aryeh Pharma Corp, these visuals offer a comprehensive scientific overview of the product's physical and chemical identity, aiding pharmacists and researchers in product verification and study.

FDA Label Image

"image Description" (Levetiracetam Fig 1)
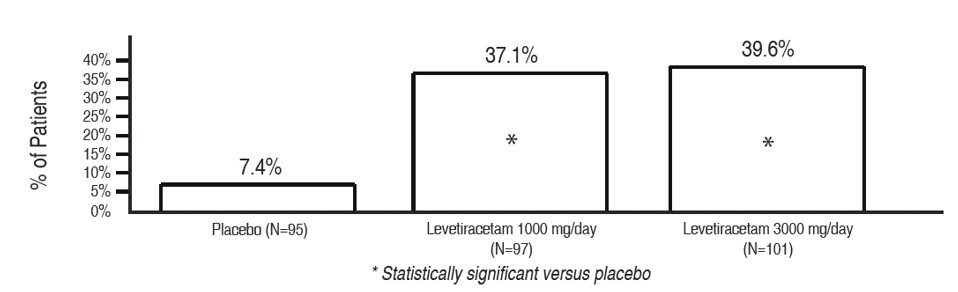
"image Description" (Levetiracetam Fig 1)
A bar graph comparing the percentage of patients responding to different treatments: Placebo, Levetiracetam 1000 mg/day, and Levetiracetam 3000 mg/day. The graph shows higher response rates for both Levetiracetam doses compared to placebo, with statistically significant differences indicated.*
FDA Label Image

"image Description" (Levetiracetam Fig 2)

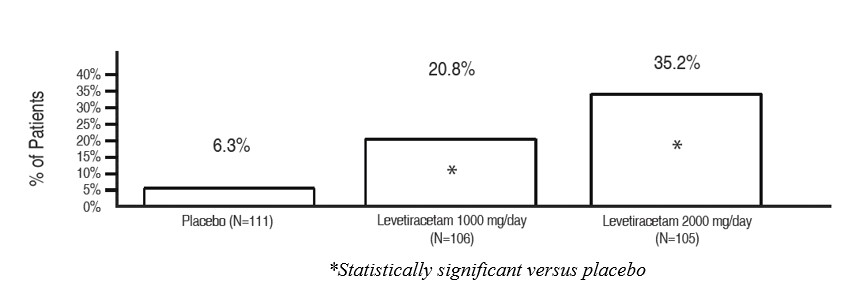
"image Description" (Levetiracetam Fig 2)
A bar graph showing the percentage of patients for placebo and two dosages of Levetiracetam (1000 mg/day and 2000 mg/day). The y-axis represents the percentage of patients, with values up to 40%. The graph indicates higher percentages for Levetiracetam groups compared to placebo, with statistical significance noted for both doses.*
FDA Label Image

"image Description" (Levetiracetam Fig 3)

"image Description" (Levetiracetam Fig 3)
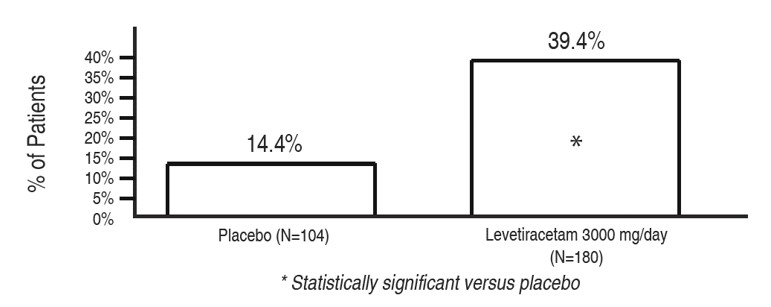
A bar chart comparing the percentage of patients between two groups: Placebo (N=104) and Levetiracetam 3000 mg/day (N=180). The chart shows 14.4% for placebo and 39.4% for Levetiracetam, with a note indicating statistical significance versus placebo.*
FDA Label Image

"image Description" (Levetiracetam Fig 4)

"image Description" (Levetiracetam Fig 4)
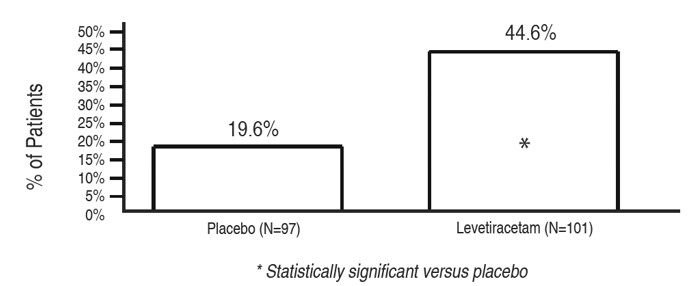
Bar chart comparing the percentage of patients for Placebo (19.6%) and Levetiracetam (44.6%) groups, indicating a statistically significant difference as noted by an asterisk. The x-axis labels the groups with patient counts, and the y-axis shows percent of patients from 0% to 50%.*
FDA Label Image

"image Description" (Levetiracetam Fig 5)

"image Description" (Levetiracetam Fig 5)
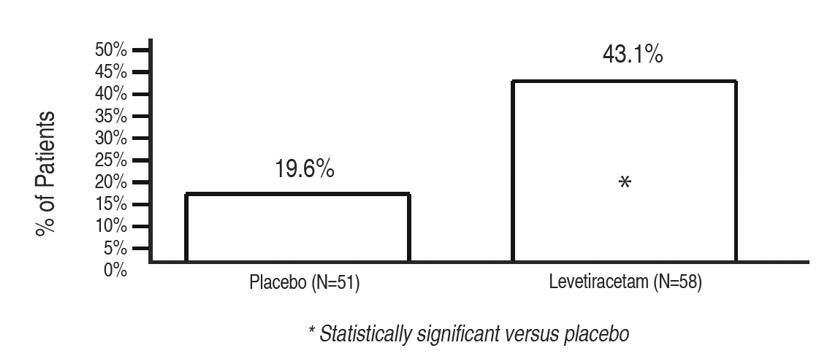
A bar chart comparing the percentage of patients between placebo (19.6%) and Levetiracetam group (43.1%). The y-axis represents the percentage of patients from 0% to 50%, and the chart notes a statistically significant difference between Levetiracetam and placebo groups.*
FDA Label Image

"image Description" (Levetiracetam Fig 6)

"image Description" (Levetiracetam Fig 6)
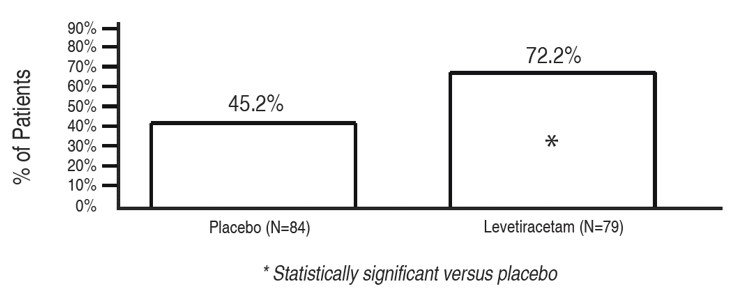
A bar chart comparing the percentage of patients between placebo and Levetiracetam groups. The placebo group (N=84) has 45.2% of patients, while the Levetiracetam group (N=79) has 72.2%. An asterisk indicates a statistically significant difference versus placebo.*
FDA Label Image

"image Description" (Levetiracetam Injection 1)

"image Description" (Levetiracetam Injection 1)
A mathematical formula for calculating total daily dose (mL/day) based on daily dose (mg/kg/day), patient weight (kg), and concentration (100 mg/mL). The formula illustrates division of the product of daily dose and patient weight by concentration.*
FDA Label Image

"image Description" (Levetiracetam Injection 2)

"image Description" (Levetiracetam Injection 2)
A text panel showing the formula for estimating creatinine clearance (CLcr), which includes variables for age, weight, serum creatinine, and a correction factor for female patients. The formula is presented in mathematical notation.*
FDA Label Image

"image Description" (Levetiracetam Injection 3)

"image Description" (Levetiracetam Injection 3)
A formula chart depicting the calculation of creatinine clearance normalized to body surface area (CLcr in mL/min/1.73m2). It shows the equation: Creatinine clearance in mL/min divided by body surface area in square meters, multiplied by 1.73.*
FDA Label Image

"image Description" (Levetiracetam Injection 4)

"image Description" (Levetiracetam Injection 4)
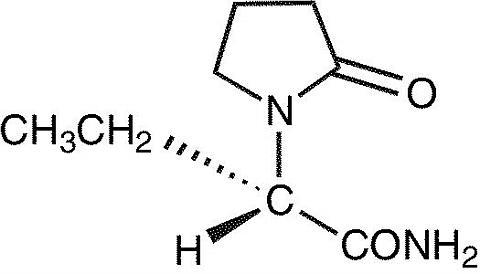
Chemical structure of levetiracetam showing a pyrrolidone ring with ethyl, hydrogen, and amide substituents attached to the central carbon.*
FDA Label Image

"image Description" (Levetiracetam Label)

"image Description" (Levetiracetam Label)
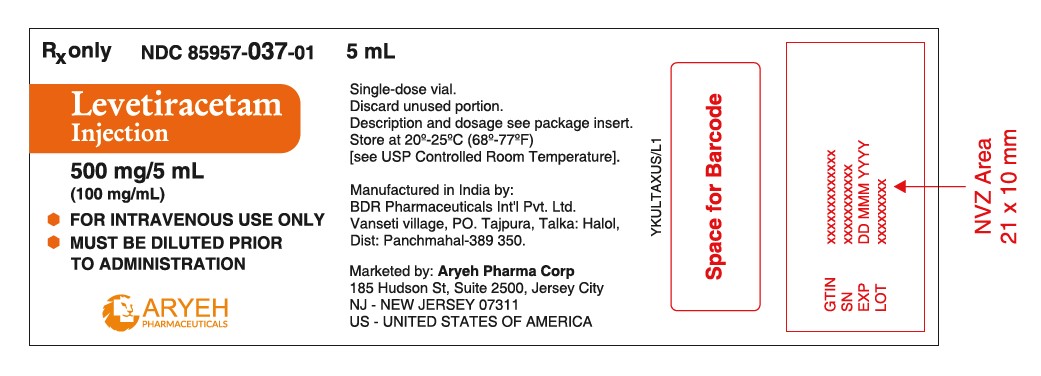
Levetiracetam Injection 500 mg/5 mL (100 mg/mL) single-dose vial label for intravenous use. The label instructs dilution prior to administration and storage at controlled room temperature. Manufactured by BDR Pharmaceuticals Int'l Pvt. Ltd. in India and marketed by Aryeh Pharma Corp, Jersey City, NJ, USA. Includes space for barcode and fields for GTIN, serial number, expiration date, and lot number.*
FDA Label Image

* About these descriptions: Image descriptions on this page are generated by automated AI analysis of the product label images from the manufacturer's FDA label submission (SPL). They are provided for reference only and may contain errors or omissions. Always rely on the printed label itself and the official FDA labeling, and consult a pharmacist or healthcare professional with any questions about this product.