Argatroban Solution
Product Images NDC 87188-104

View Photos of Packaging, Regulatory Labels, and Product Appearance

Product Visual Gallery

This gallery contains 7 technical images submitted to the FDA as part of the official labeling for Argatroban (NDC 87188-104). Unlike standard consumer photos, these assets often include clinical data figures, molecular chemical structures, and official manufacturer packaging layouts.

As provided by Plano Pharmaceuticals Inc., these visuals offer a comprehensive scientific overview of the product's physical and chemical identity, aiding pharmacists and researchers in product verification and study.

FDA Label Image

Vial Label (1)

Vial Label (1)
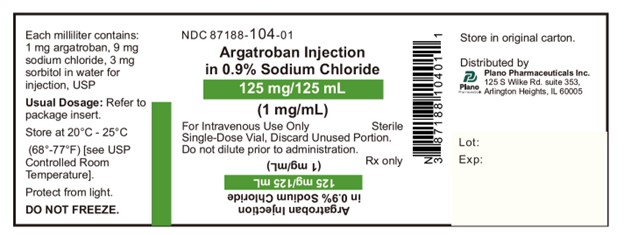
Label for Argatroban Injection in 0.9% Sodium Chloride, 125 mg/125 mL (1 mg/mL) intravenous solution by Plano Pharmaceuticals Inc. The label includes dosage strength, ingredients per mL, storage instructions, single-dose vial usage, and distributor information with the product NDC 87188-104-01.*
FDA Label Image

Carton Label (2)

Carton Label (2)
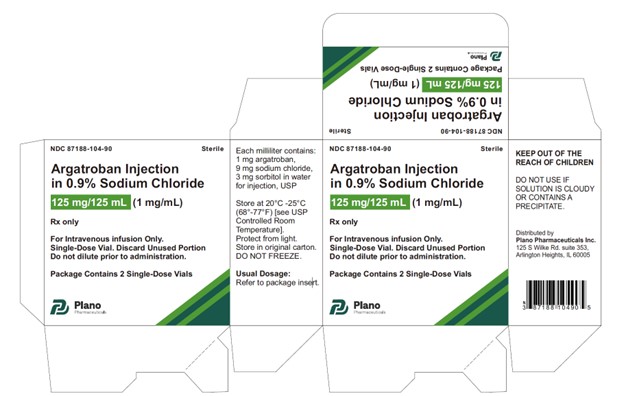
Packaging label for Argatroban Injection 125 mg/125 mL (1 mg/mL) solution for intravenous use. The label indicates the product is sterile, for single-dose via infusion, and contains 2 single-dose vials per package. It lists ingredients, storage conditions, and is labeled by Plano Pharmaceuticals Inc. The label includes warnings against diluting or multiple dosing and cautions about solution clarity.*
FDA Label Image

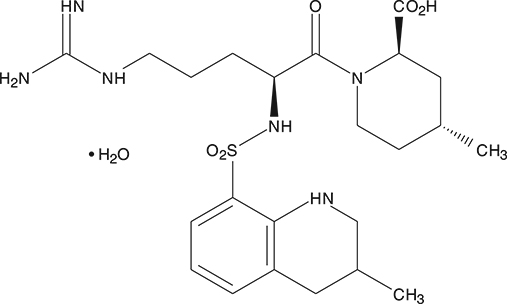
Argatroban-chemical-structure (Argatroban 01)

Argatroban-chemical-structure (Argatroban 01)
Chemical structure diagram of argatroban, depicting its molecular components including amine groups, sulfonyl, carbonyl, and carboxyl groups with stereochemical configuration, as part of its structural formula.*
FDA Label Image

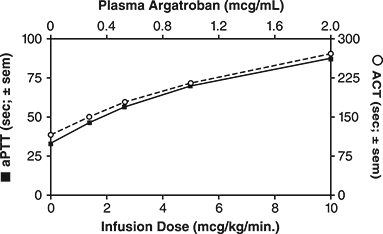
Figure-1 (Argatroban 02)

Figure-1 (Argatroban 02)
A line graph depicting the relationship between infusion dose (mcg/kg/min) on the X-axis and plasma Argatroban concentration (mcg/mL) on the top X-axis. The left Y-axis shows activated partial thromboplastin time (aPTT, sec) and the right Y-axis shows activated clotting time (ACT, sec), both plotted as mean values with standard error bars. Two closely aligned curves represent aPTT and ACT changes with increasing infusion dose.*
FDA Label Image

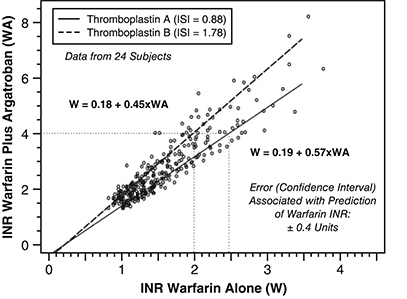
Figure-2 (Argatroban 03)

Figure-2 (Argatroban 03)
A scatter plot comparing INR values of warfarin alone versus warfarin plus argatroban. The graph includes two regression lines labeled Thromboplastin A and Thromboplastin B, with corresponding ISI values. Data points from 24 subjects are plotted, showing relationships between INR measurements with and without argatroban.*
FDA Label Image

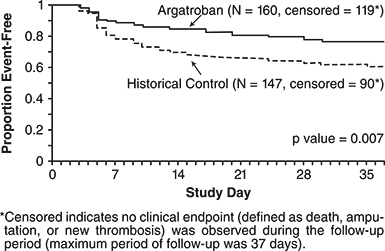
Figure-3 (Argatroban 04)

Figure-3 (Argatroban 04)
A survival curve graph showing the proportion of event-free patients over a 37-day study period, comparing Argatroban treatment (solid line) to a historical control (dashed line). The y-axis represents the proportion event-free, and the x-axis shows the study days. A p-value of 0.007 is noted, indicating statistical comparison between the two groups.*
FDA Label Image

Figure-4 (Argatroban 05)

Figure-4 (Argatroban 05)
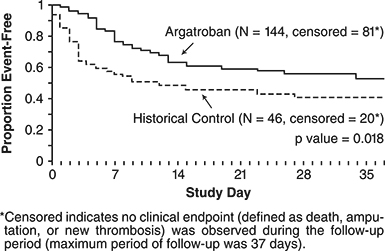
A Kaplan-Meier survival curve graph comparing the proportion of event-free subjects over time between Argatroban and Historical Control groups. The X-axis represents study days up to 35 days, and the Y-axis shows the proportion event-free from 0 to 1. The Argatroban group (N=144) shows higher event-free proportions than the Historical Control group (N=46), with a p value of 0.018 indicating statistical significance.*

* About these descriptions: Image descriptions on this page are generated by automated AI analysis of the product label images from the manufacturer's FDA label submission (SPL). They are provided for reference only and may contain errors or omissions. Always rely on the printed label itself and the official FDA labeling, and consult a pharmacist or healthcare professional with any questions about this product.