Levetiracetam Tablet, Film Coated
Product Images NDC 87234-0035

View Photos of Packaging, Regulatory Labels, and Product Appearance

Product Visual Gallery

This gallery contains 22 technical images submitted to the FDA as part of the official labeling for Levetiracetam (NDC 87234-0035). Unlike standard consumer photos, these assets often include clinical data figures, molecular chemical structures, and official manufacturer packaging layouts.

As provided by Injecta Medcial Llc, these visuals offer a comprehensive scientific overview of the product's physical and chemical identity, aiding pharmacists and researchers in product verification and study.

FDA Label Image

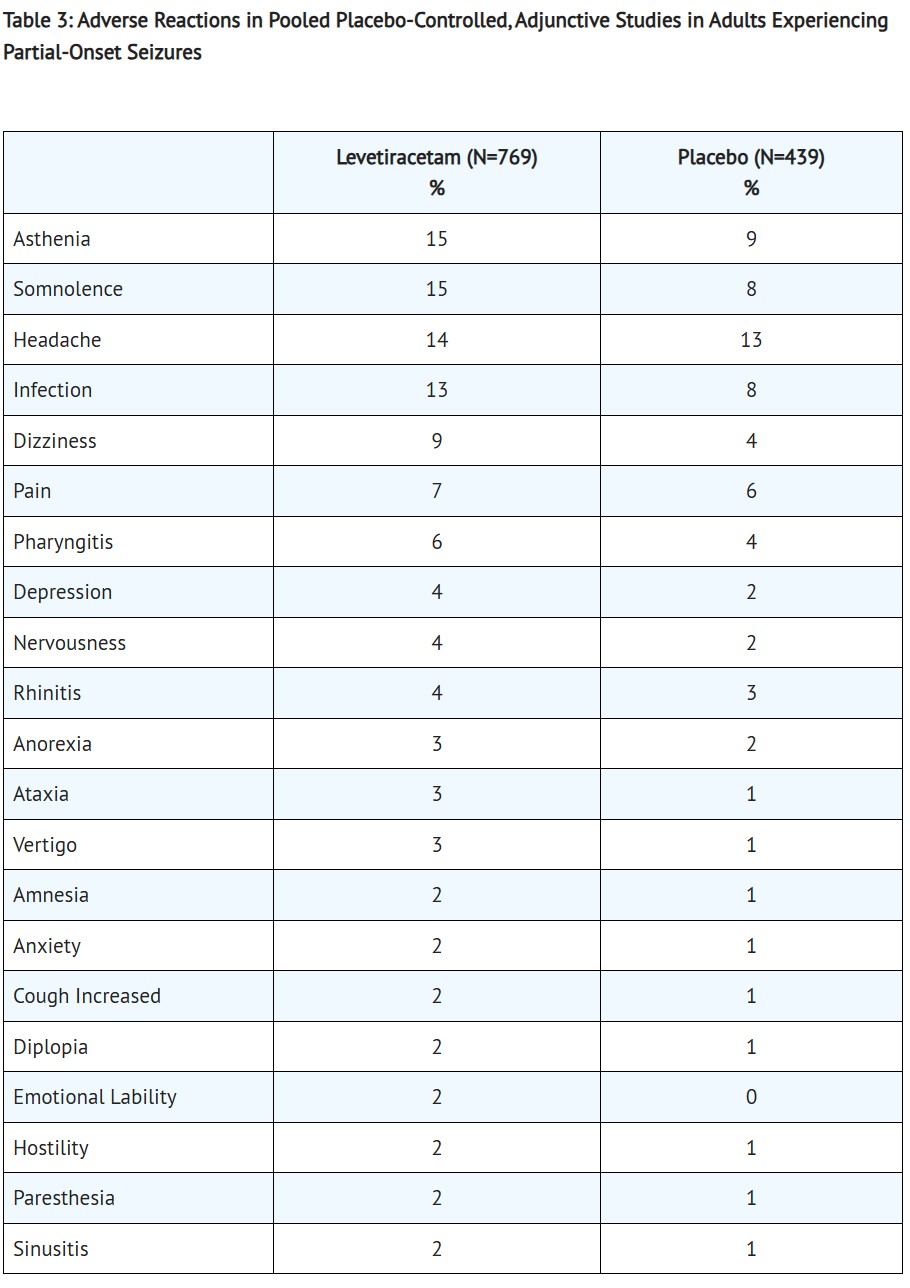
Table 3 (Table 3)

Table 3 (Table 3)
A data table titled 'Adverse Reactions in Pooled Placebo-Controlled, Adjunctive Studies in Adults Experiencing Partial-Onset Seizures' showing the percentage incidence of various adverse reactions in adults treated with Levetiracetam (N=769) compared to placebo (N=439). The table lists 20 different adverse reactions with corresponding percentage values for both groups.*
FDA Label Image

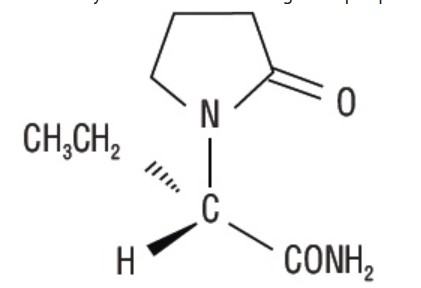
Chemical Formula (Chemical Formula Lev)

Chemical Formula (Chemical Formula Lev)
Chemical structure diagram of Levetiracetam, showing its molecular formula with a pentagonal ring containing nitrogen, and side chains including an ethyl group and an amide group.*
FDA Label Image

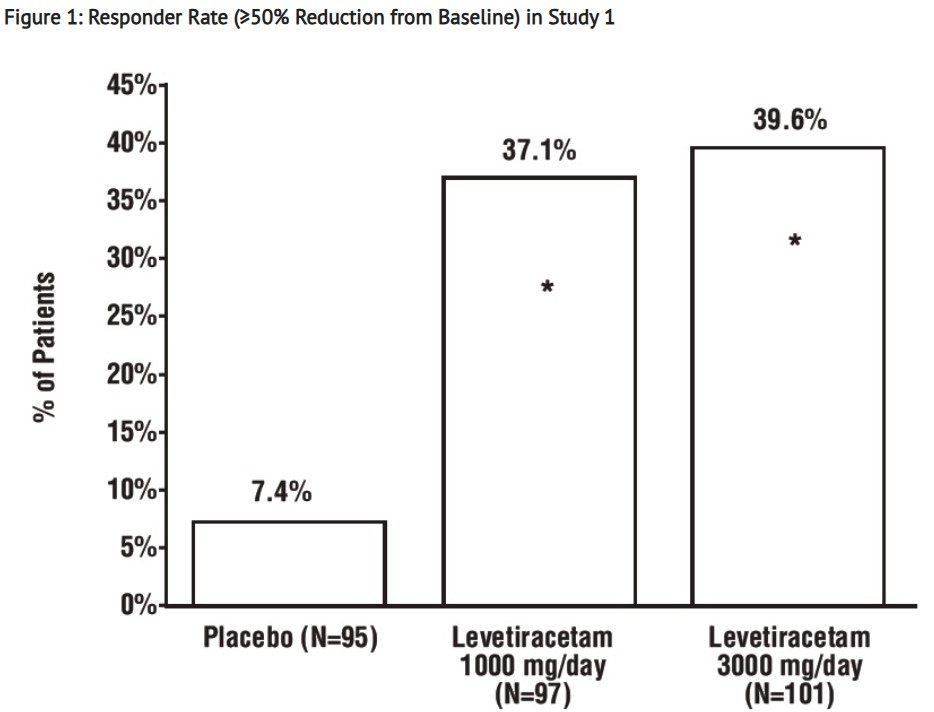
Responder Rate (≥50% Reduction From Baseline) In Study 1 (Figure 1 Lev)

Responder Rate (≥50% Reduction From Baseline) In Study 1 (Figure 1 Lev)
A bar graph showing responder rates with ≥50% reduction from baseline in Study 1 for Levetiracetam at 1000 mg/day and 3000 mg/day compared to placebo. The y-axis represents percentage of patients, with placebo at 7.4%, Levetiracetam 1000 mg/day at 37.1%, and Levetiracetam 3000 mg/day at 39.6% responder rates.*
FDA Label Image

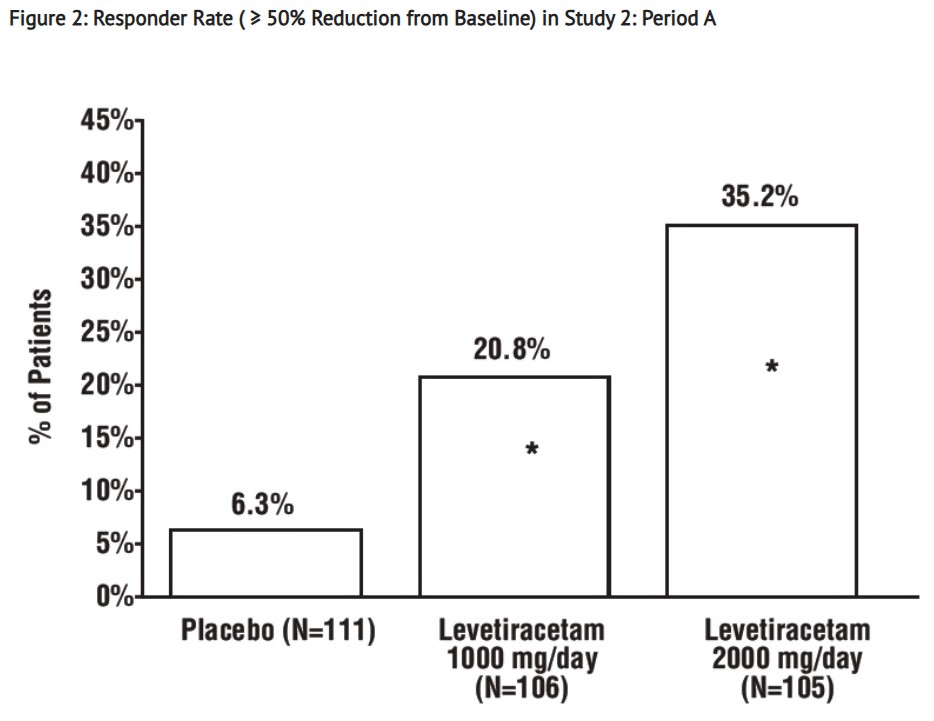
Responder Rate ( ≥ 50% Reduction From Baseline) In Study 2: Period A (Figure 2 Lev)

Responder Rate ( ≥ 50% Reduction From Baseline) In Study 2: Period A (Figure 2 Lev)
A bar chart titled 'Responder Rate (≥ 50% Reduction from Baseline) in Study 2: Period A' showing percentages of patients responding. The x-axis compares Placebo (N=111), Levetiracetam 1000 mg/day (N=106), and Levetiracetam 2000 mg/day (N=105). The y-axis shows the percentage of patients from 0% to 45%. Responder rates are approximately 6.3% for placebo, 20.8% for Levetiracetam 1000 mg/day, and 35.2% for Levetiracetam 2000 mg/day.*
FDA Label Image

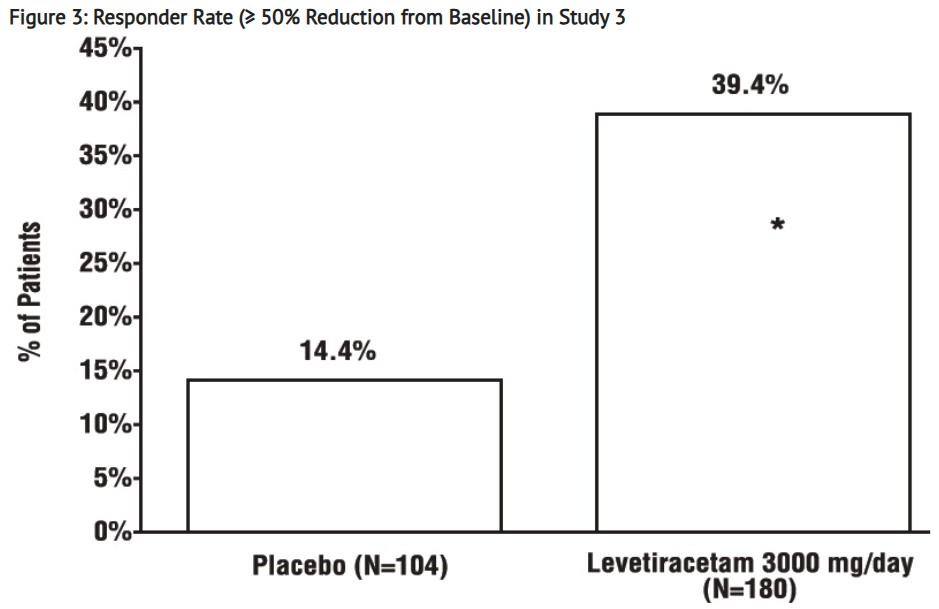
Responder Rate (≥ 50% Reduction From Baseline) In Study 3 (Figure 3 Lev)

Responder Rate (≥ 50% Reduction From Baseline) In Study 3 (Figure 3 Lev)
A bar chart titled 'Responder Rate (>= 50% Reduction from Baseline) in Study 3' compares the percentage of patients responding to Placebo (N=104) and Levetiracetam 3000 mg/day (N=180). The y-axis shows the percentage of patients from 0% to 45%. The responder rate is 14.4% for Placebo and 39.4% for Levetiracetam 3000 mg/day.*
FDA Label Image

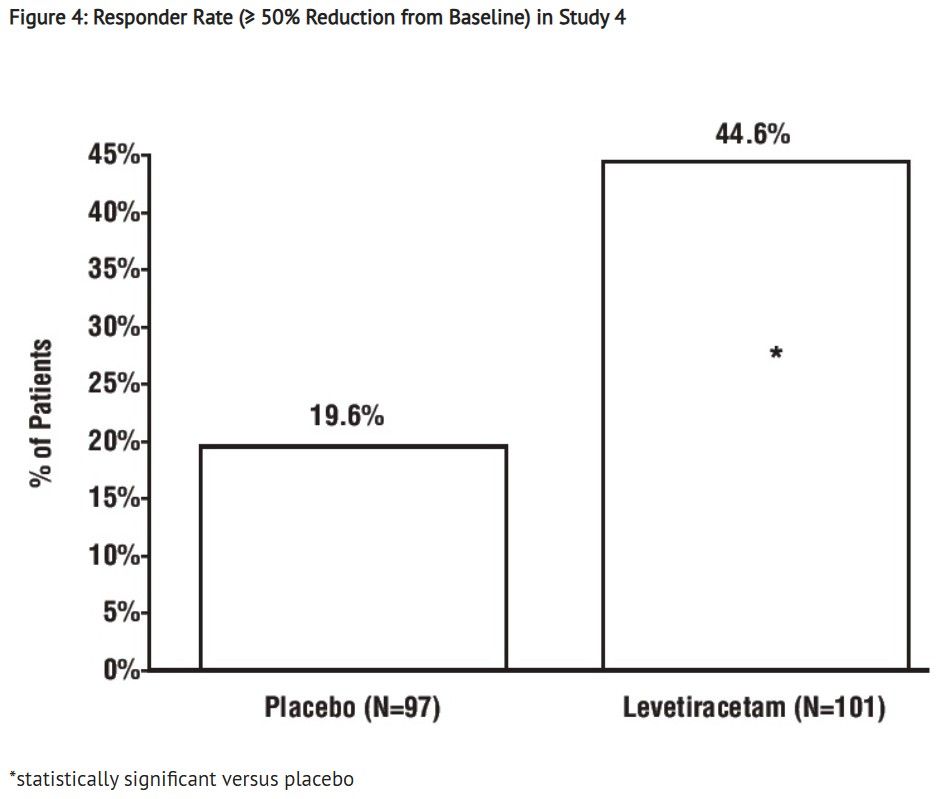
Responder Rate (≥ 50% Reduction From Baseline) In Study 4 (Figure 4 Lev)

Responder Rate (≥ 50% Reduction From Baseline) In Study 4 (Figure 4 Lev)
Bar chart showing responder rates with at least 50% reduction from baseline comparing placebo and Levetiracetam in Study 4. The y-axis represents percentage of patients. Placebo group (N=97) shows 19.6% responders, while Levetiracetam group (N=101) shows 44.6% responders, marked as statistically significant versus placebo.*
FDA Label Image

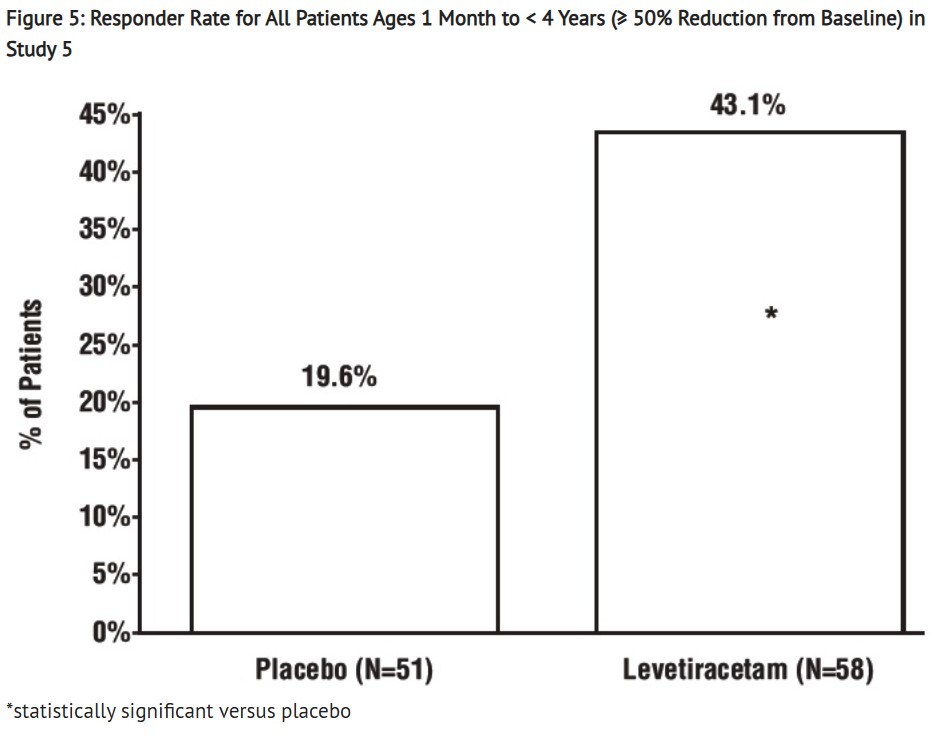
Responder Rate For All Patients Ages 1 Month To < 4 Years (≥ 50% Reduction From Baseline) In Study 5 (Figure 5 Lev)

Responder Rate For All Patients Ages 1 Month To < 4 Years (≥ 50% Reduction From Baseline) In Study 5 (Figure 5 Lev)
A bar graph titled 'Responder Rate for All Patients Ages 1 Month to <4 Years (≥ 50% Reduction from Baseline) in Study 5' comparing the percentage of patients responding to treatment. The y-axis shows percent of patients from 0% to 45%. Two bars represent Placebo (N=51) at 19.6% and Levetiracetam (N=58) at 43.1%, with an asterisk indicating statistical significance versus placebo.*
FDA Label Image

Label (Levetiracetam 500 Label)

Label (Levetiracetam 500 Label)
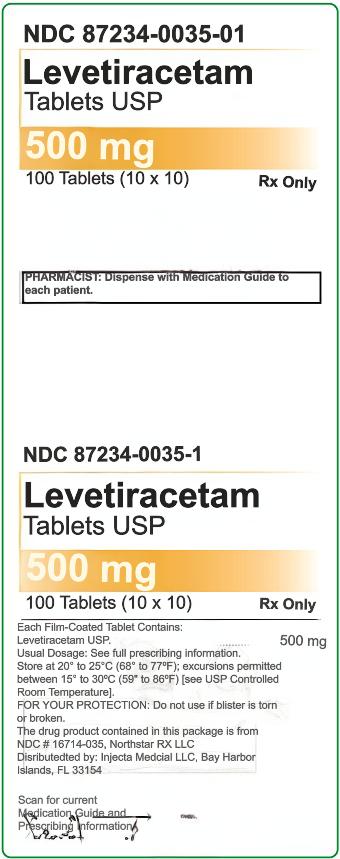
Levetiracetam 500 mg film-coated tablets in a 100-count (10 x 10) package, labeled for oral use. The label states it is an Rx-only prescription drug by Injecta Medical LLC. The NDC number is 87234-0035-01. Additional text includes storage instructions, a note to dispense a medication guide to each patient, and manufacturer and distributor information.*
FDA Label Image

Table 4 (Table 4 Lev)

Table 4 (Table  4 Lev)
Table showing adverse reactions resulting in discontinuation or dose reduction in placebo-controlled studies for adult patients with partial-onset seizures, comparing Levetiracetam (N=769) and placebo (N=439). It lists somnolence and dizziness with corresponding percentages for both groups.*
FDA Label Image

Dosing Adjustment Regimen For Adult Patients With Renal Impairment (Table 1)

Dosing Adjustment Regimen For Adult Patients With Renal Impairment (Table 1)
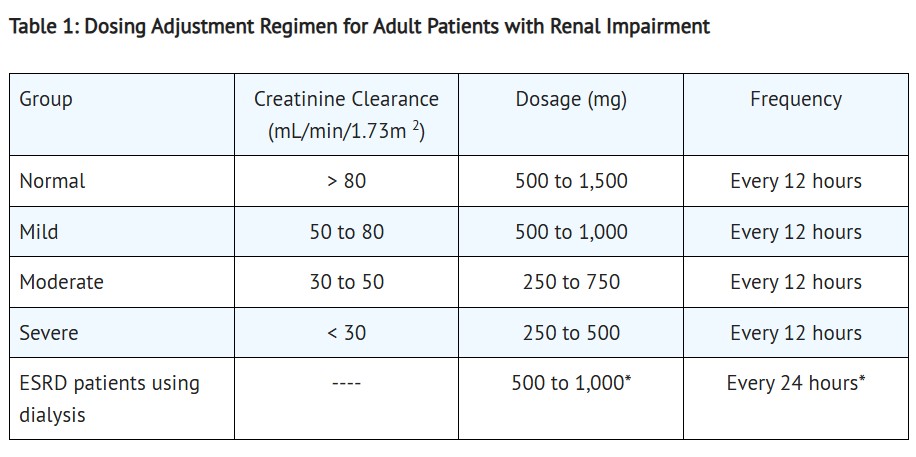
A dosing adjustment table for adult patients with renal impairment for Levetiracetam. It categorizes patients by creatinine clearance levels (Normal > 80, Mild 50-80, Moderate 30-50, Severe < 30, and ESRD patients using dialysis) and lists corresponding dosage ranges in mg with dosing frequency, typically every 12 hours, except ESRD patients who dose every 24 hours.*
FDA Label Image

Reduction In Mean Over Placebo In Weekly Frequency Of Partial-onset Seizures In Study 1 (Table 10 Lev)

Reduction In Mean Over Placebo In Weekly Frequency Of Partial-onset Seizures In Study 1 (Table 10 Lev)
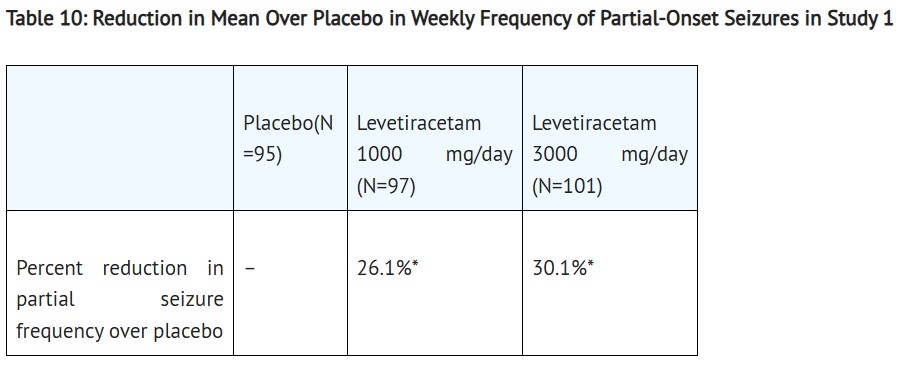
A table titled 'Reduction in Mean Over Placebo in Weekly Frequency of Partial-Onset Seizures in Study 1' summarizing percent reduction in partial seizure frequency comparing placebo and Levetiracetam doses of 1000 mg/day and 3000 mg/day. It shows 26.1% reduction for 1000 mg/day and 30.1% for 3000 mg/day.*
FDA Label Image

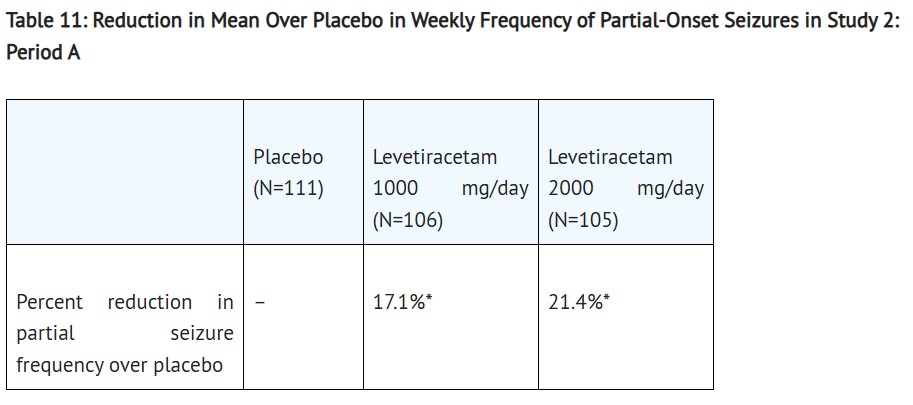
Reduction In Mean Over Placebo In Weekly Frequency Of Partial-onset Seizures In Study 2: Period A (Table 11 Lev)

Reduction In Mean Over Placebo In Weekly Frequency Of Partial-onset Seizures In Study 2: Period A (Table 11 Lev)
Table showing reduction in mean weekly frequency of partial-onset seizures over placebo from Study 2 Period A. It compares Placebo (N=111) with Levetiracetam 1000 mg/day (N=106) showing 17.1% reduction, and Levetiracetam 2000 mg/day (N=105) showing 21.4% reduction.*
FDA Label Image

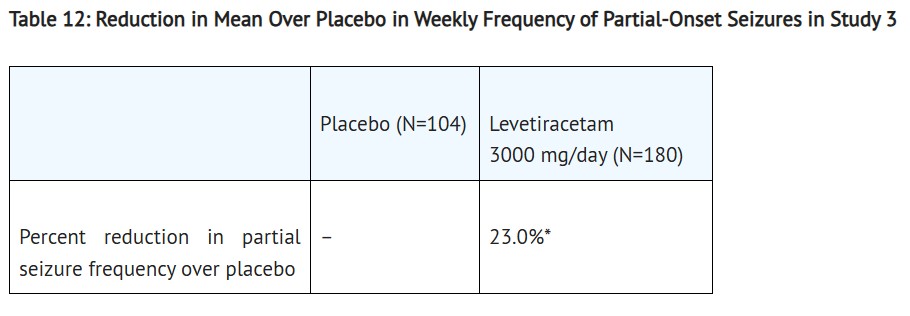
Reduction In Mean Over Placebo In Weekly Frequency Of Partial-onset Seizures In Study 3 (Table 12 Lev)

Reduction In Mean Over Placebo In Weekly Frequency Of Partial-onset Seizures In Study 3 (Table 12 Lev)
A data table titled 'Reduction in Mean Over Placebo in Weekly Frequency of Partial-Onset Seizures in Study 3' showing percent reduction in partial seizure frequency over placebo. It compares placebo group (N=104) with Levetiracetam 3000 mg/day group (N=180), with a reported 23.0% reduction for the Levetiracetam group.*
FDA Label Image

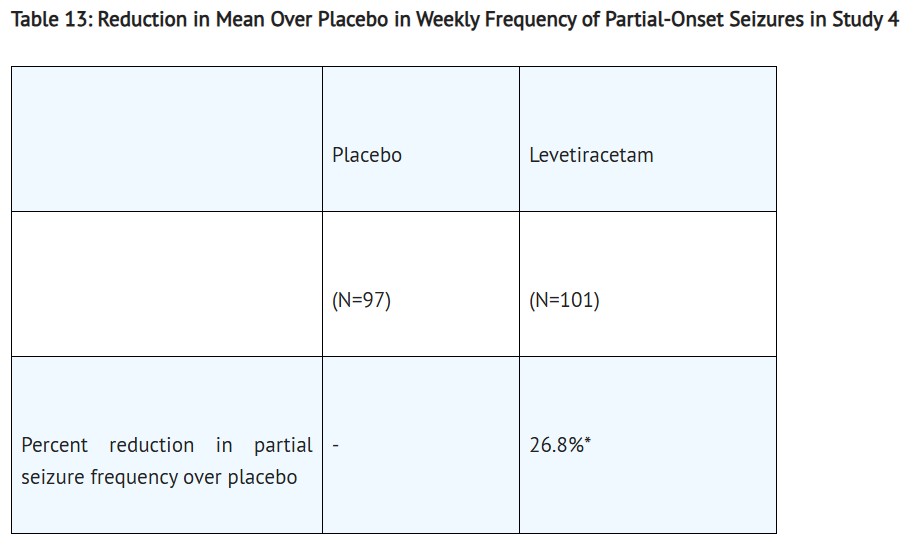
Reduction In Mean Over Placebo In Weekly Frequency Of Partial-onset Seizures In Study 4 (Table 13 Lev)

Reduction In Mean Over Placebo In Weekly Frequency Of Partial-onset Seizures In Study 4 (Table 13 Lev)
A data table titled 'Reduction in Mean Over Placebo in Weekly Frequency of Partial-Onset Seizures in Study 4,' comparing Placebo (N=97) and Levetiracetam (N=101). It shows a 26.8% reduction in partial seizure frequency for Levetiracetam over placebo.*
FDA Label Image

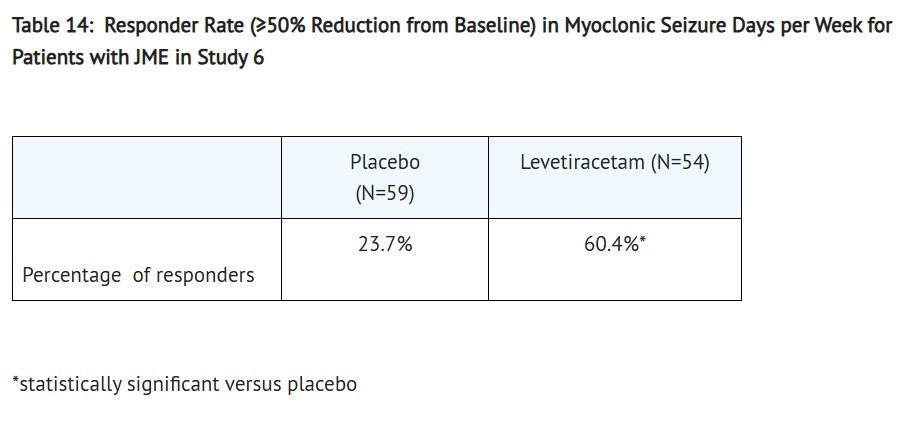
Responder Rate (≥50% Reduction From Baseline) In Myoclonic Seizure Days Per Week For Patients With Jme In Study 6 (Table 14 Lev)

Responder Rate (≥50% Reduction From Baseline) In Myoclonic Seizure Days Per Week For Patients With Jme In Study 6 (Table 14 Lev)
Data table titled 'Responder Rate (≥50% Reduction from Baseline) in Myoclonic Seizure Days per Week for Patients with JME in Study 6' comparing placebo and Levetiracetam (N=54). It shows the percentage of responders for placebo (23.7%) and Levetiracetam (60.4%, statistically significant versus placebo).*
FDA Label Image

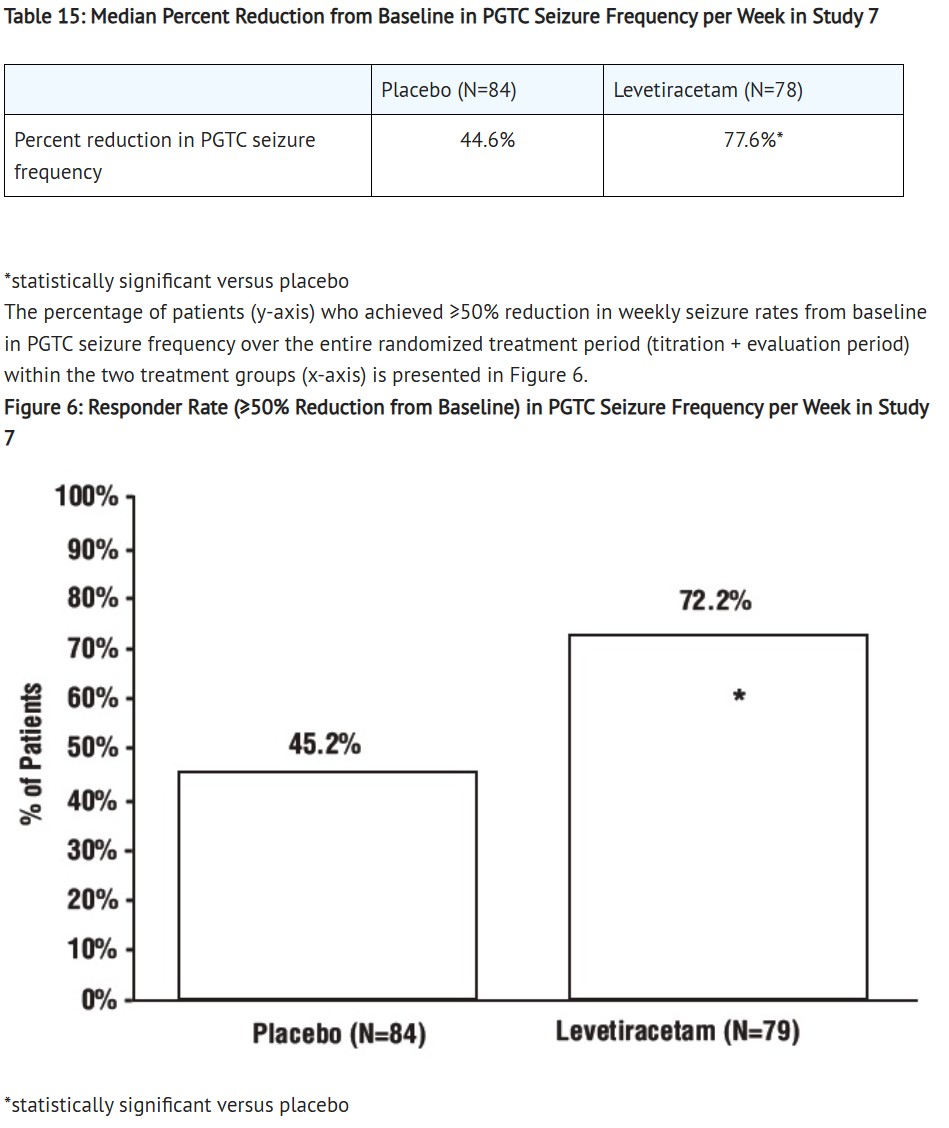
Median Percent Reduction From Baseline In Pgtc Seizure Frequency Per Week In Study 7 (Table 15 Lev)

Median Percent Reduction From Baseline In Pgtc Seizure Frequency Per Week In Study 7 (Table 15 Lev)
Data table and bar graph presenting median percent reduction from baseline in PGTC seizure frequency per week comparing placebo and Levetiracetam groups in Study 7. The table shows 44.6% reduction for placebo and 77.6% for Levetiracetam. The bar graph depicts responder rates with 45.2% of placebo patients and 72.2% of Levetiracetam patients achieving ≥50% reduction, highlighting statistical significance for Levetiracetam versus placebo.*
FDA Label Image

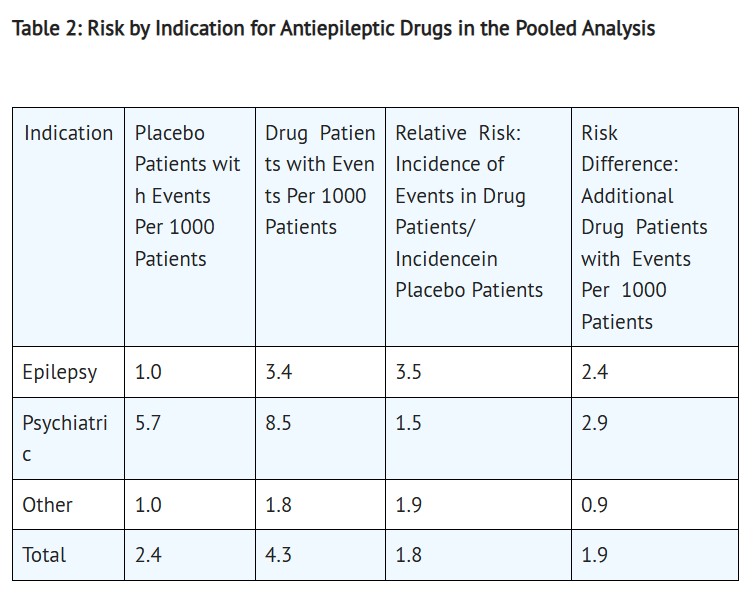
Risk By Indication For Antiepileptic Drugs In The Pooled Analysis (Table 2)

Risk By Indication For Antiepileptic Drugs In The Pooled Analysis (Table 2)
A data table titled 'Risk by Indication for Antiepileptic Drugs in the Pooled Analysis.' It presents comparative risk metrics between placebo and drug patients across indications such as epilepsy, psychiatric, and other. Columns include incidence of events per 1000 patients, relative risk, and risk difference for additional drug patients with events.*
FDA Label Image

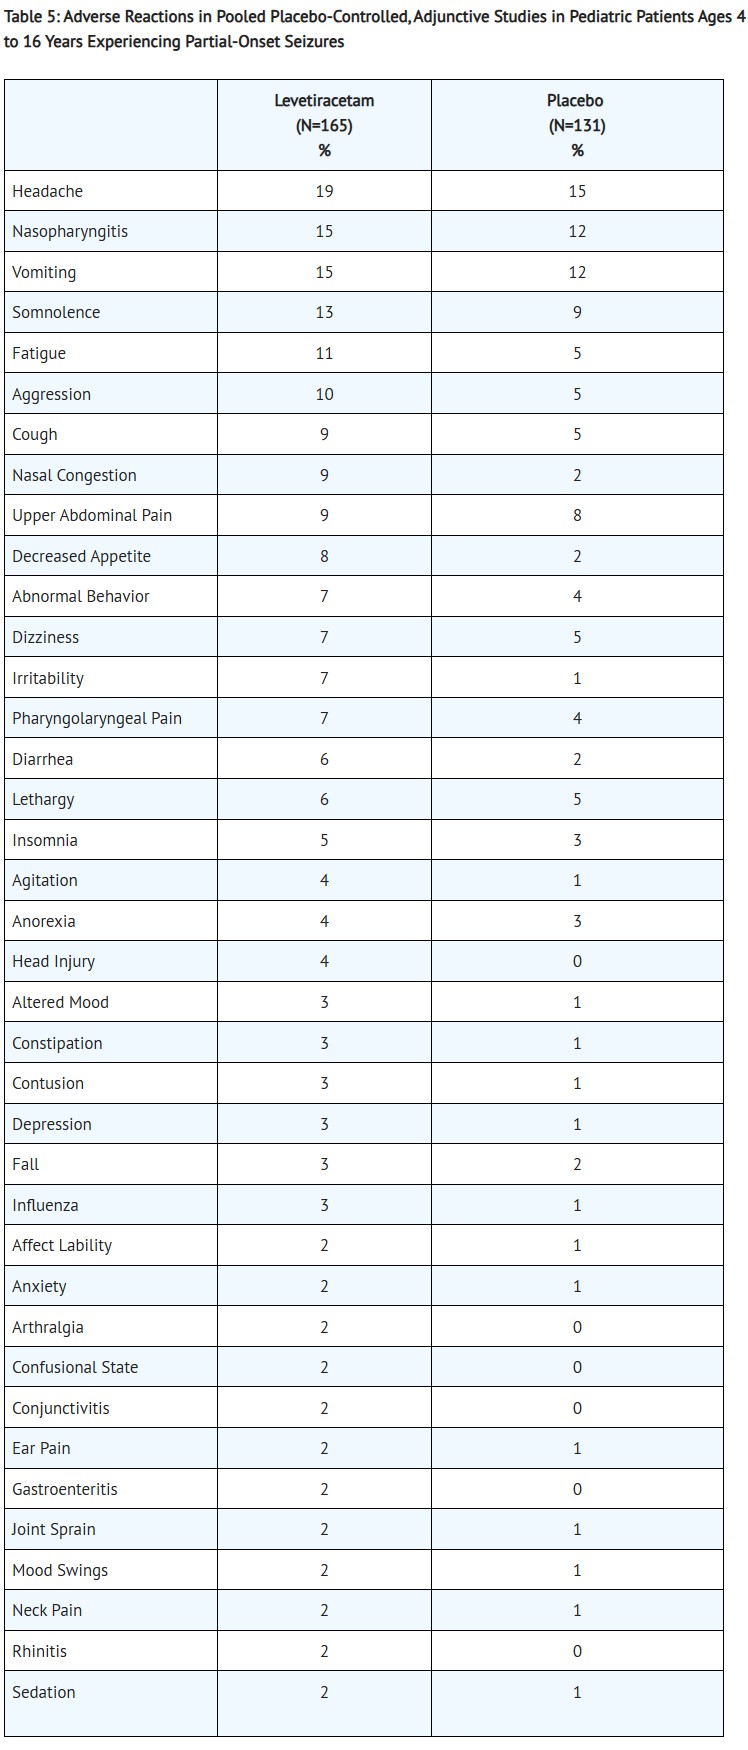
Table 5 (Table 5 Lev)

Table 5 (Table 5 Lev)
Table showing adverse reactions in pediatric patients aged 4 to 16 years experiencing partial-onset seizures in pooled placebo-controlled adjunctive studies. The table compares the percentage of patients experiencing each adverse reaction between Levetiracetam (N=165) and placebo (N=131) groups, listing reactions such as headache, somnolence, fatigue, and irritability among others.*
FDA Label Image

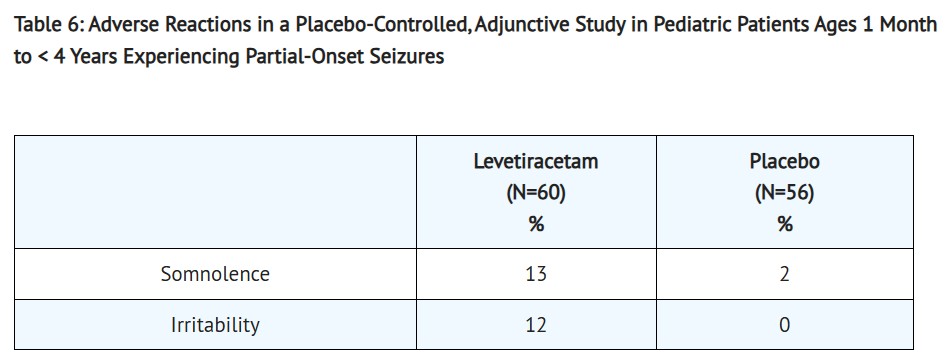
Table 6 (Table 6 Lev)

Table 6 (Table 6 Lev)
A data table presenting adverse reactions in a placebo-controlled adjunctive study in pediatric patients aged 1 month to less than 4 years with partial-onset seizures. It compares the percentage incidences of somnolence and irritability between Levetiracetam (N=60) and placebo (N=56) groups, showing higher rates for both reactions in the Levetiracetam group.*
FDA Label Image

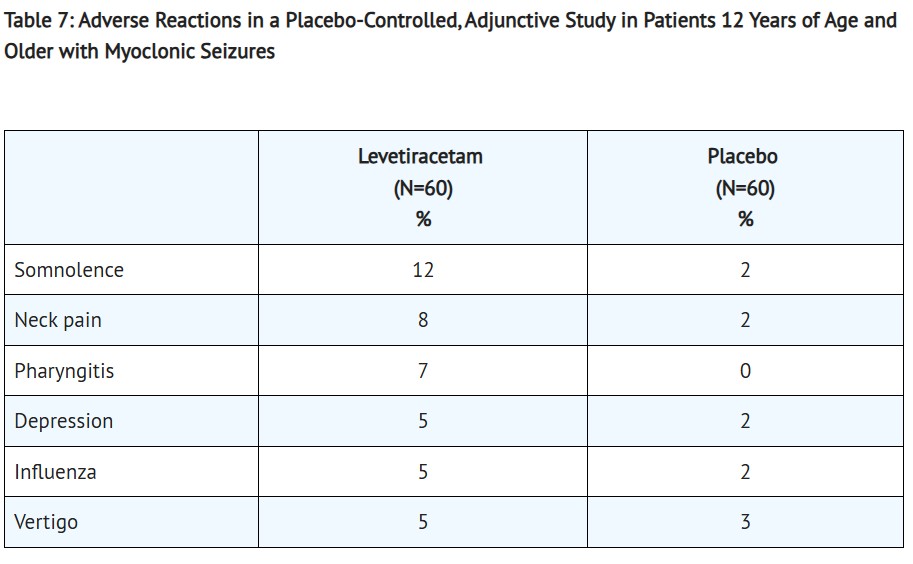
Table 7 (Table 7 Lev)

Table 7 (Table 7 Lev)
A data table titled 'Table 7: Adverse Reactions in a Placebo-Controlled, Adjunctive Study in Patients 12 Years of Age and Older with Myoclonic Seizures' comparing the percentage of patients experiencing specific adverse reactions between Levetiracetam (N=60) and placebo (N=60). The table lists somnolence, neck pain, pharyngitis, depression, influenza, and vertigo with corresponding percentages for each group.*
FDA Label Image

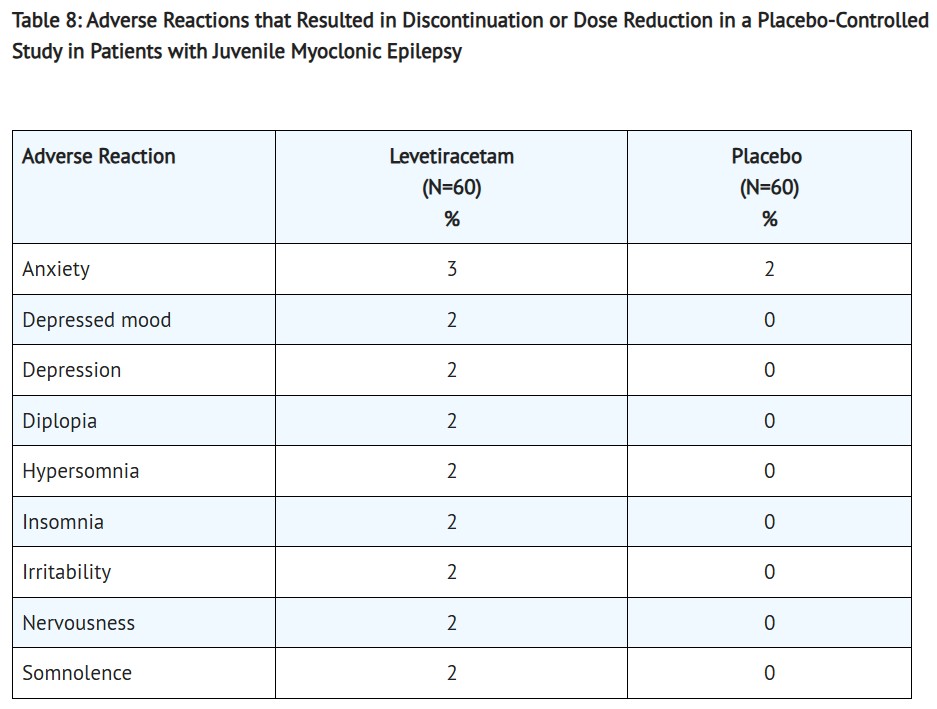
Table 8 (Table 8 Lev)

Table 8 (Table 8 Lev)
A table listing adverse reactions that led to discontinuation or dose reduction in a placebo-controlled study of patients with juvenile myoclonic epilepsy. The table compares the percentage of patients experiencing symptoms like anxiety, depressed mood, depression, diplopia, hypersomnia, insomnia, irritability, nervousness, and somnolence between those treated with Levetiracetam (N=60) and placebo (N=60).*
FDA Label Image

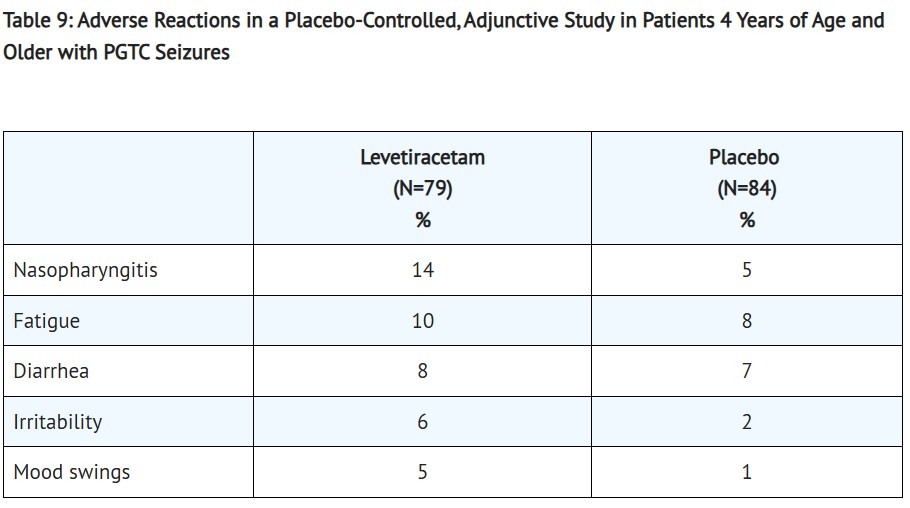
Table 9 (Table 9 Levs)

Table 9 (Table 9 Levs)
A data table titled 'Adverse Reactions in a Placebo-Controlled, Adjunctive Study in Patients 4 Years of Age and Older with PGTC Seizures.' It compares the percentage of patients experiencing nasopharyngitis, fatigue, diarrhea, irritability, and mood swings between Levetiracetam (N=79) and placebo (N=84) groups.*

* About these descriptions: Image descriptions on this page are generated by automated AI analysis of the product label images from the manufacturer's FDA label submission (SPL). They are provided for reference only and may contain errors or omissions. Always rely on the printed label itself and the official FDA labeling, and consult a pharmacist or healthcare professional with any questions about this product.