Gabapentin Tablet
Product Images NDC 87441-036
View Photos of Packaging, Regulatory Labels, and Product Appearance
Product Visual Gallery
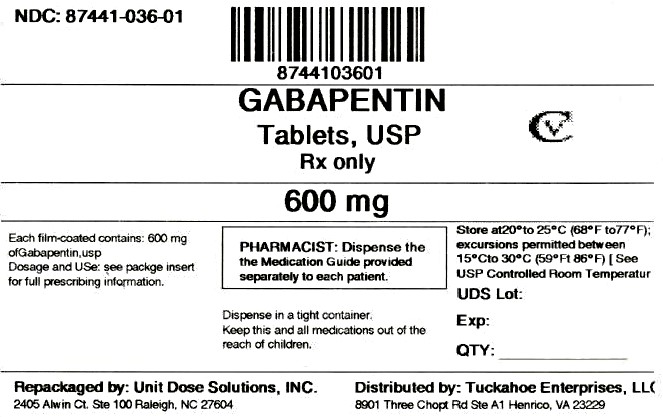
This gallery contains 7 technical images submitted to the FDA as part of the official labeling for Gabapentin (NDC 87441-036). Unlike standard consumer photos, these assets often include clinical data figures, molecular chemical structures, and official manufacturer packaging layouts.
As provided by Unit Dose Solutions, Inc., these visuals offer a comprehensive scientific overview of the product's physical and chemical identity, aiding pharmacists and researchers in product verification and study.
Equation (Equation)
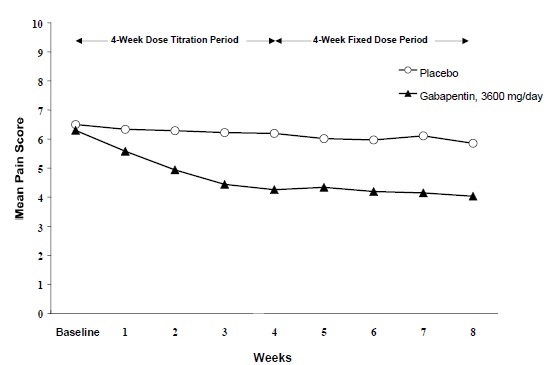
Fig1 (Fig1)
Fig2 (Fig2)
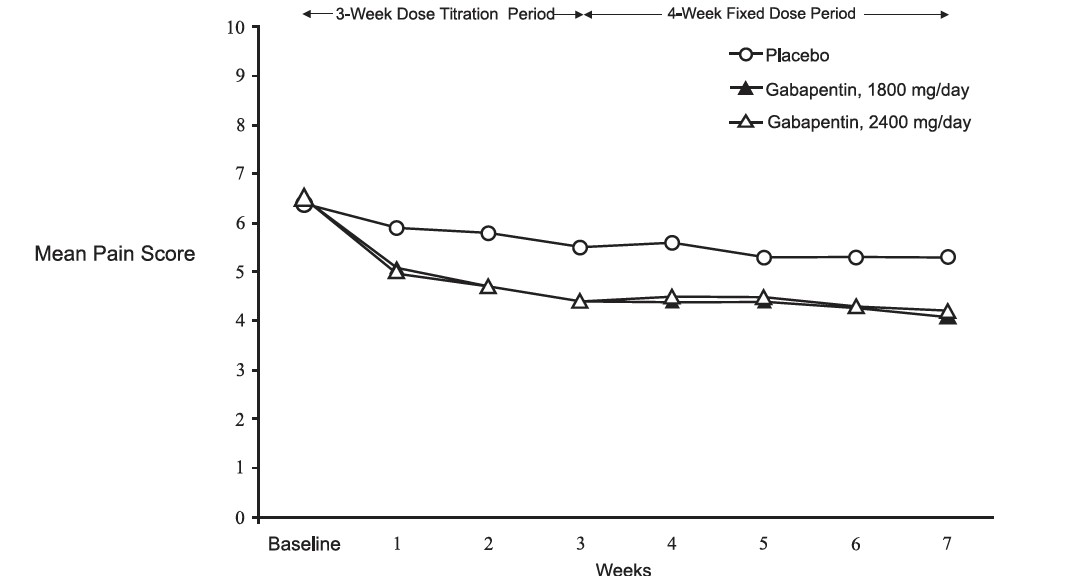
This information is about a pain study evaluating mean pain scores over a 3-week dose titration period followed by a 4-week fixed dose period. The study includes a placebo group and two different doses of gabapentin (1800 mg/day and 2400 mg/day). Data is collected at baseline and weekly intervals throughout the study.*
Fig3 (Fig3)
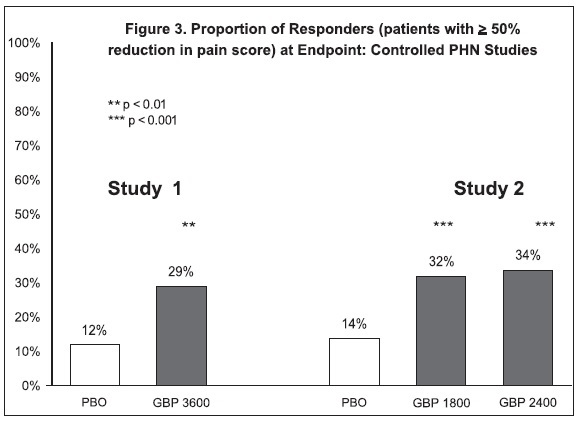
This text contains numerical data related to the proportion of responders (patients with a 50% reduction in pain score) in controlled studies related to post-herpetic neuralgia (PHN). The information is presented in a chart format, depicting percentages of responders at different levels of pain reduction. Study 1 and Study 2 are referenced along with placebo (PBO) and doses of GBP (potentially a medication) at 3600mg and 1800mg. The significance levels of *p<0.01 and *+p<0.001 are also mentioned in the text.*
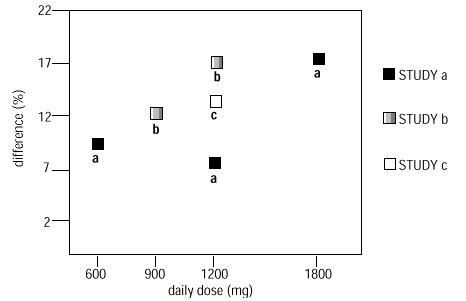
Figure 4 (Fig4)
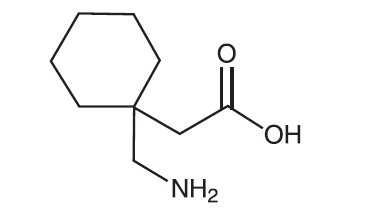
Molecula Formula Gabapentin (Structure)
* These product label images have been analyzed using experimental machine learning. Please verify findings with the primary label text.