Levetiracetam Tablet, Film Coated
Product Images NDC 87441-046

View Photos of Packaging, Regulatory Labels, and Product Appearance

Product Visual Gallery

This gallery contains 9 technical images submitted to the FDA as part of the official labeling for Levetiracetam (NDC 87441-046). Unlike standard consumer photos, these assets often include clinical data figures, molecular chemical structures, and official manufacturer packaging layouts.

As provided by Unit Dose Solutions, Inc., these visuals offer a comprehensive scientific overview of the product's physical and chemical identity, aiding pharmacists and researchers in product verification and study.

FDA Label Image

Levetiracetam 500 mg (8744104601 Levetiracetam 500 mg)
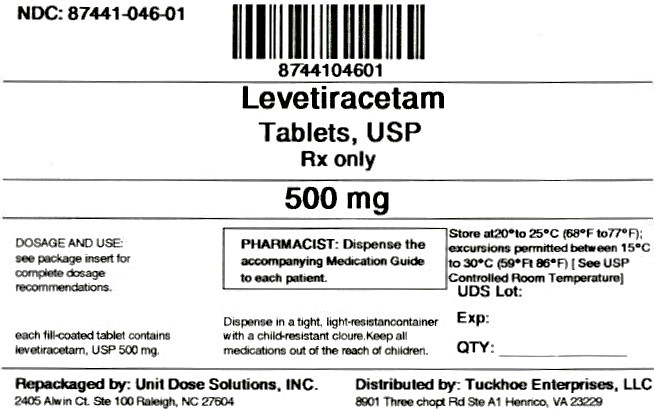
Levetiracetam 500 mg (8744104601 Levetiracetam 500 mg)
This text contains information about Levetiracetam tablets in 500 mg strength, with NDC 87441-046-01. It includes dosage and use instructions for pharmacists, storage recommendations, lot number, expiration date, and the repackaged and distributed information. The medication is prescribed for use and should be kept in a tight, light-resistant container at controlled room temperature.*
FDA Label Image

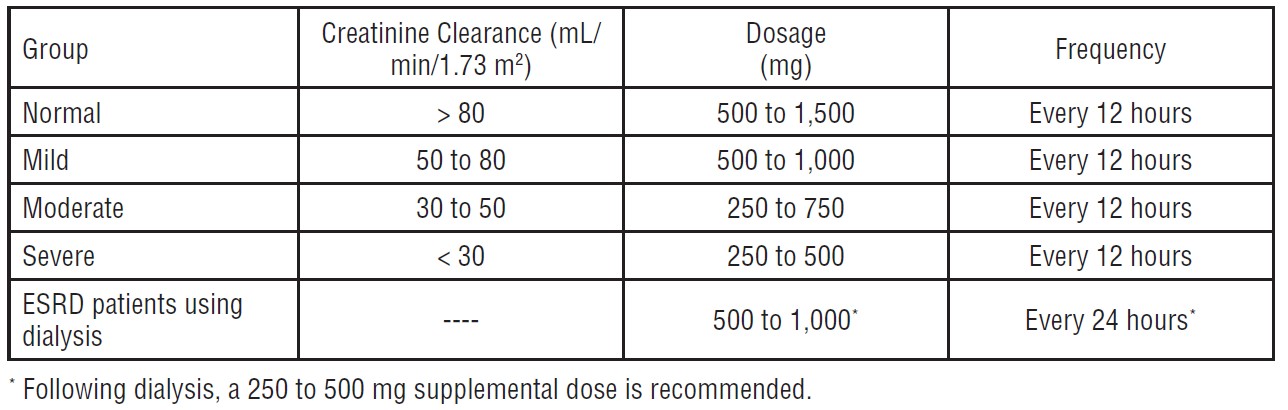
Table 1 (Table 1)

Table 1 (Table 1)
This text provides a guideline for dosage adjustment based on creatinine clearance levels for different categories such as normal, mild, moderate, and severe impairment. It also includes special dosing recommendations for end-stage renal disease (ESRD) patients undergoing dialysis, suggesting a supplemental dose post-dialysis.*
FDA Label Image

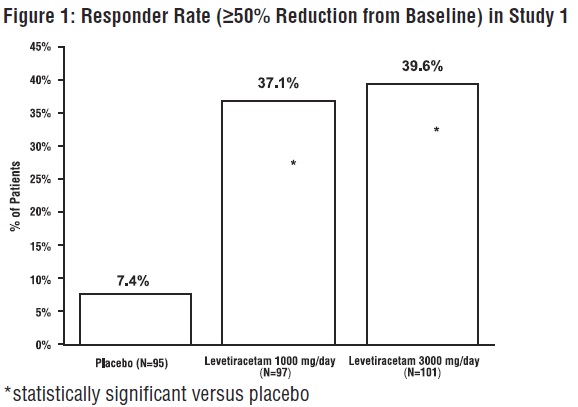
Figure 1: Responder Rate (≥50% Reduction From Baseline) In Study 1 (Levetiracetam Fig1)

Figure 1: Responder Rate (≥50% Reduction From Baseline) In Study 1 (Levetiracetam Fig1)
This description provides information on the responder rate (250% reduction from baseline) shown in Study 1. The data presented includes various percentages ranging from 2% to 39.6%. The results indicate that a certain treatment was statistically significant compared to the placebo group.*
FDA Label Image

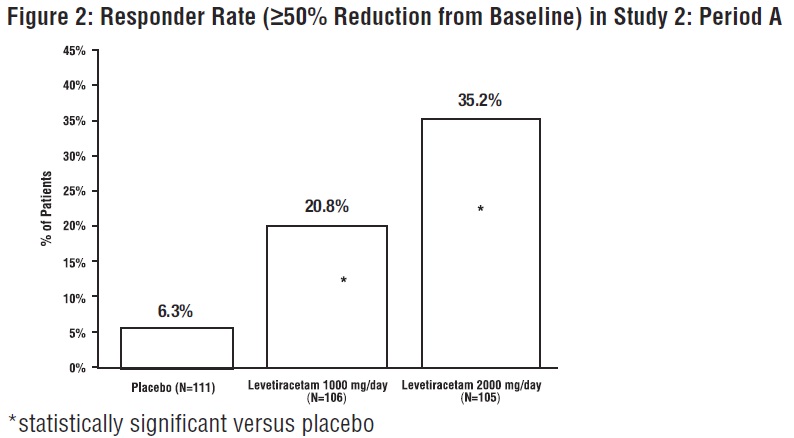
Figure 2: Responder Rate (≥50% Reduction From Baseline) In Study 2: Period A (Levetiracetam Fig2)

Figure 2: Responder Rate (≥50% Reduction From Baseline) In Study 2: Period A (Levetiracetam Fig2)
This is a description of a study comparing the Responder Rate (250% Reduction from Baseline) in Study 2 during Period A. The data includes percentages of responders for different treatment groups: Placebo, Levetiracetam 1000 mg/day, and Levetiracetam 2000 mg/day. It highlights a statistically significant difference in response rates between one of the Levetiracetam groups and the Placebo group.*
FDA Label Image

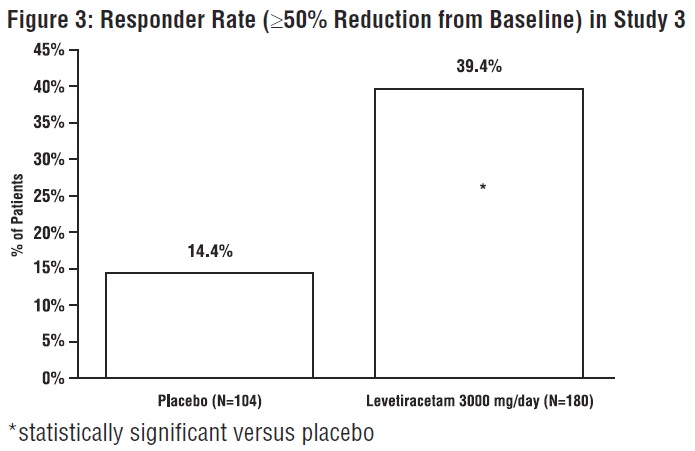
Figure 3: Responder Rate (≥50% Reduction From Baseline) In Study 3 (Levetiracetam Fig3)

Figure 3: Responder Rate (≥50% Reduction From Baseline) In Study 3 (Levetiracetam Fig3)
This description indicates the Responder Rate with over 50% reduction from baseline in Study 3. The results show a 45% responder rate for those on Levetiracetam 3000 mg/day compared to 39.4% for the placebo group. These results were statistically significant, highlighting the effectiveness of Levetiracetam compared to the placebo in this study.*
FDA Label Image

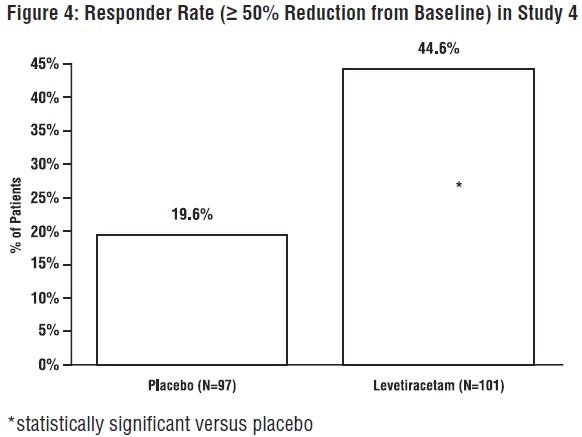
Figure 4: Responder Rate (≥ 50% Reduction From Baseline) In Study 4 (Levetiracetam Fig4)

Figure 4: Responder Rate (≥ 50% Reduction From Baseline) In Study 4 (Levetiracetam Fig4)
This text presents data on the Responder Rate (50% Reduction from Baseline) in Study 4, comparing the placebo group (N=97) to the Levetiracetam group (N=101). The Responder Rate was 44.6% for Levetiracetam and 19.6% for placebo. The Levetiracetam group exhibited a statistically significant improvement in responder rate compared to the placebo group.*
FDA Label Image

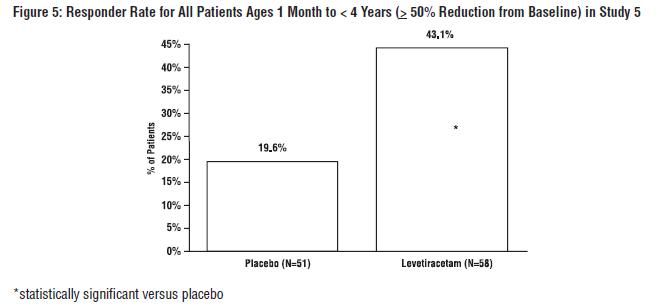
Figure 5: Responder Rate For All Patients Ages 1 Month To < 4 Years (≥ 50% Reduction From Baseline) In Study 5 (Levetiracetam Fig5)

Figure 5: Responder Rate For All Patients Ages 1 Month To < 4 Years (≥ 50% Reduction From Baseline) In Study 5 (Levetiracetam Fig5)
This text provides information on the Responder Rate for all patients aged 1 month to < 4 years showing more than a 50% reduction from baseline in Study 5. The data shows Placebo (451) and Lovetracatam (4-58) and indicates that Lovetracatam has a statistically significant difference when compared to placebo.*
FDA Label Image

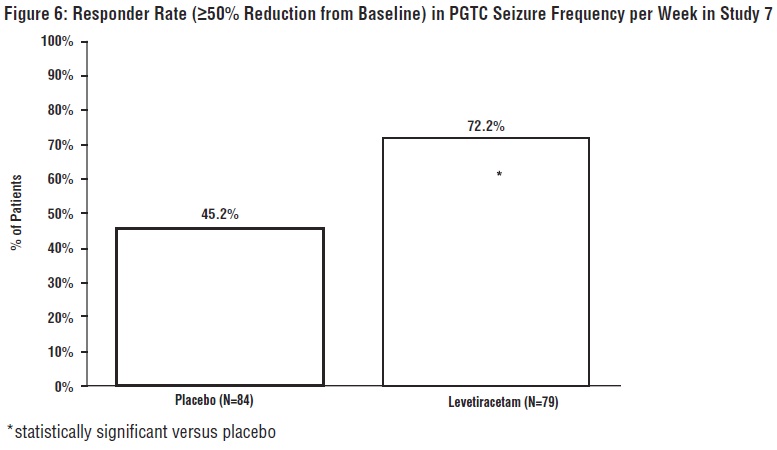
Figure 6: Responder Rate (≥50% Reduction From Baseline) In Pgtc Seizure Frequency Per Week In Study 7 (Levetiracetam Fig6)

Figure 6: Responder Rate (≥50% Reduction From Baseline) In Pgtc Seizure Frequency Per Week In Study 7 (Levetiracetam Fig6)
This text presents data on the Responder Rate (250% Reduction from Baseline) in PGTC Seizure Frequency per Week in Study 7. The graph shows the percentage of responders in the placebo and Levetiracetam groups, with Levetiracetam demonstrating a significant improvement in reducing seizures compared to placebo. The study included 84 patients in the placebo group and 79 patients in the Levetiracetam group.*
FDA Label Image

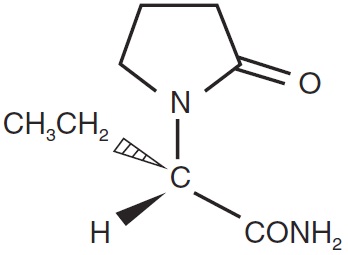
Chemical Structure (Levetiracetam Str)

* These product label images have been analyzed using experimental machine learning. Please verify findings with the primary label text.