Quetiapine Fumarate Tablet
Product Images NDC 87441-071

View Photos of Packaging, Regulatory Labels, and Product Appearance

Product Visual Gallery

This gallery contains 4 technical images submitted to the FDA as part of the official labeling for Quetiapine Fumarate (NDC 87441-071). Unlike standard consumer photos, these assets often include clinical data figures, molecular chemical structures, and official manufacturer packaging layouts.

As provided by Unit Dose Solutions, Inc., these visuals offer a comprehensive scientific overview of the product's physical and chemical identity, aiding pharmacists and researchers in product verification and study.

FDA Label Image

Quetiapine 50 mg (8744107101 Quetiapine 50 mg)
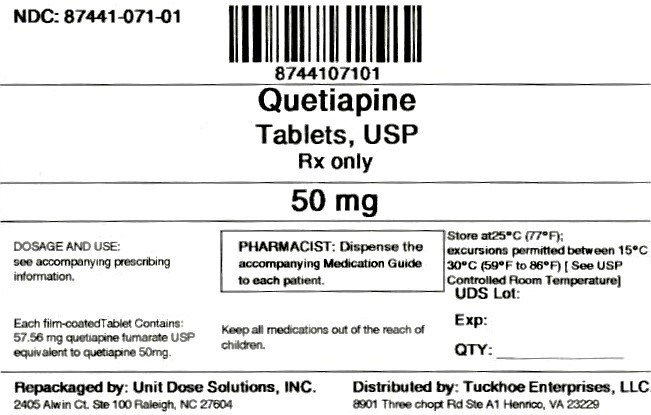
Quetiapine 50 mg (8744107101 Quetiapine 50 mg)
Quetiapine Tablets USP 50 mg oral tablets label. The label includes dispensing instructions for pharmacists, dosage information stating each tablet contains 57.56 mg quetiapine fumarate USP equivalent to 50 mg quetiapine, and storage conditions. It is repackaged by Unit Dose Solutions, Inc. and distributed by Tuckhoe Enterprises, LLC. The label also features an NDC barcode and spaces for lot number, expiration date, and quantity.*
FDA Label Image

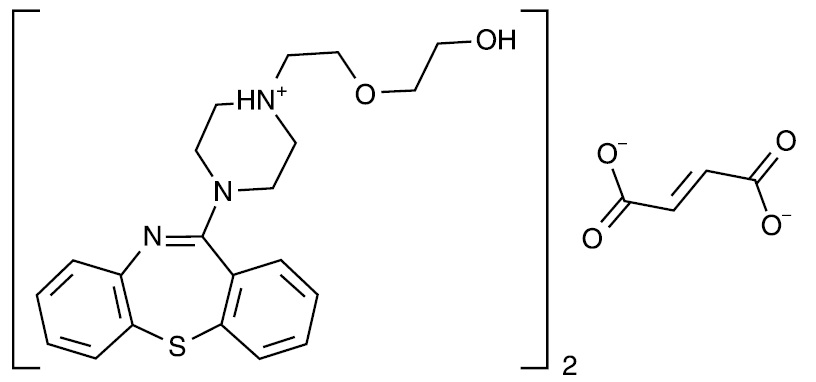
Molecular Structure (874e50ad 5da0 4ac3 9290 79442c91399e 01)

Molecular Structure (874e50ad 5da0 4ac3 9290 79442c91399e 01)
Chemical structure of quetiapine fumarate, showing the quetiapine moiety with a sulfur-containing tricyclic ring and a substituted piperazine, paired with the fumarate ion structure.*
FDA Label Image

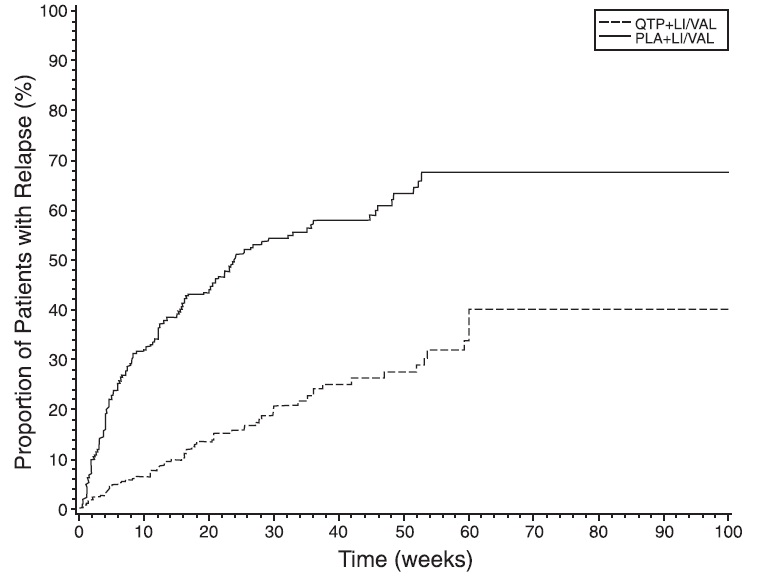
Figure 1 (874e50ad 5da0 4ac3 9290 79442c91399e 02)

Figure 1 (874e50ad 5da0 4ac3 9290 79442c91399e 02)
A line graph showing the proportion of patients with relapse (%) over time in weeks (0 to 100). Two groups are compared: QTP+LI/VAL (dashed line) and PLA+LI/VAL (solid line). The y-axis represents the percentage of relapsed patients, with the PLA+LI/VAL group reaching about 70% relapse and the QTP+LI/VAL group about 40% relapse at the study end.*
FDA Label Image

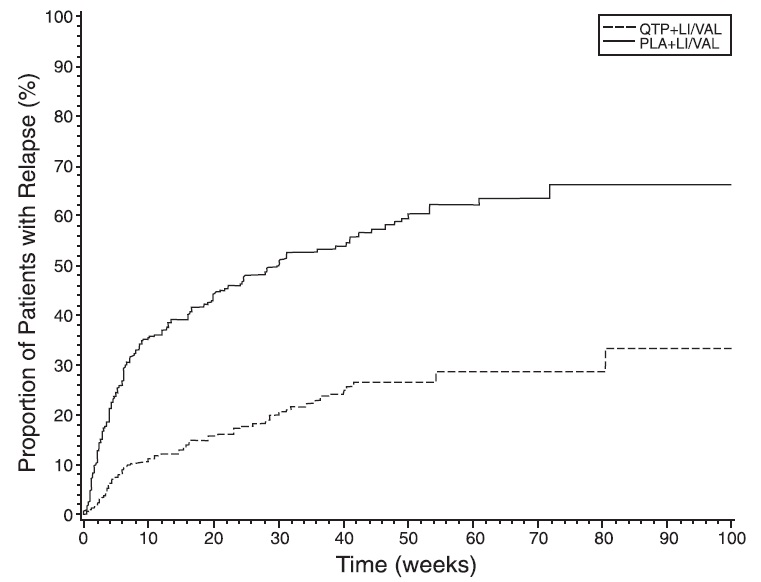
Figure 2 (874e50ad 5da0 4ac3 9290 79442c91399e 03)

Figure 2 (874e50ad 5da0 4ac3 9290 79442c91399e 03)
A line graph comparing the proportion of patients with relapse (%) over time in weeks up to 100 weeks. Two treatment groups are shown: one with QTP+LI/VAL (dashed line) and the other with PLA+LI/VAL (solid line). The graph indicates the relapse rates for these groups throughout the study period.*

* About these descriptions: Image descriptions on this page are generated by automated AI analysis of the product label images from the manufacturer's FDA label submission (SPL). They are provided for reference only and may contain errors or omissions. Always rely on the printed label itself and the official FDA labeling, and consult a pharmacist or healthcare professional with any questions about this product.