Trospium Chloride Tablet, Film Coated
Product Images NDC 90096-141

View Photos of Packaging, Regulatory Labels, and Product Appearance

Product Visual Gallery

This gallery contains 11 technical images submitted to the FDA as part of the official labeling for Trospium Chloride (NDC 90096-141). Unlike standard consumer photos, these assets often include clinical data figures, molecular chemical structures, and official manufacturer packaging layouts.

As provided by Zameer Pharmaceuticals Llc, these visuals offer a comprehensive scientific overview of the product's physical and chemical identity, aiding pharmacists and researchers in product verification and study.

FDA Label Image

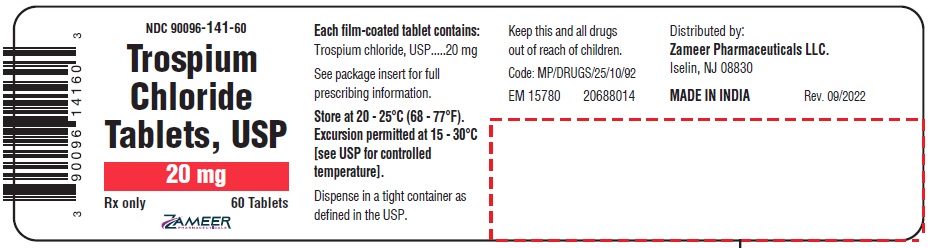
Label (Label Tros)

Label (Label Tros)
Label for Trospium Chloride Tablets USP, 20 mg, film-coated oral tablets. The label states the product contains 60 tablets and is distributed by Zameer Pharmaceuticals LLC in Iselin, NJ. It includes storage instructions (20-25°C, excursion permitted 15-30°C) and notes that the tablets contain 20 mg Trospium chloride USP. The product is made in India.*
FDA Label Image

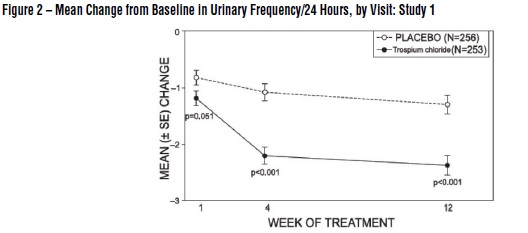
Fig 2 (Draft Labeling 1)

Fig 2 (Draft Labeling 1)
A line graph showing the mean change from baseline in urinary frequency over 24 hours by visit in Study 1. The graph compares data for Trospium Chloride versus placebo over 1, 4, and 12 weeks of treatment. The y-axis represents mean change with standard error, and the x-axis shows weeks of treatment.*
FDA Label Image

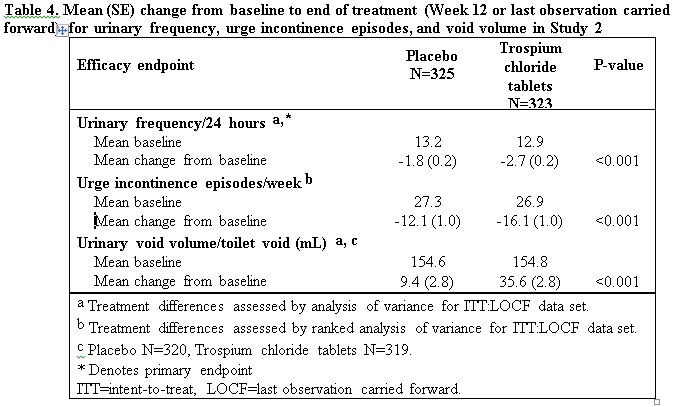
Table 4 (Draft Labeling 10)

Table 4 (Draft Labeling 10)
A data table presenting efficacy endpoints comparing placebo and Trospium chloride tablets from a clinical study. It shows mean baseline values and mean changes from baseline for urinary frequency per 24 hours, urge incontinence episodes per week, and urinary void volume per toilet void (mL), along with P-values indicating statistical significance. Footnotes explain analysis methods and sample sizes.*
FDA Label Image

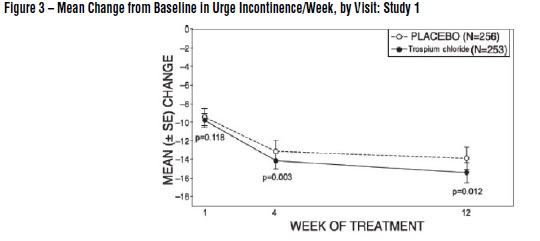
Fig 3 (Draft Labeling 2)

Fig 3 (Draft Labeling 2)
A line graph showing the mean change from baseline in urge incontinence episodes per week over 12 weeks of treatment from Study 1. The x-axis represents weeks (1, 4, 12), and the y-axis shows mean change with standard error bars. Two groups are compared: placebo (N=256) and Trospium chloride (N=253), with p-values indicating statistical significance at weeks 4 and 12.*
FDA Label Image

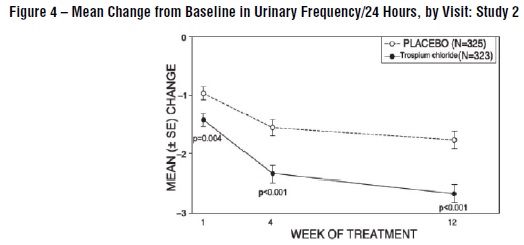
Fig 4 (Draft Labeling 3)

Fig 4 (Draft Labeling 3)
A line graph titled 'Mean Change from Baseline in Urinary Frequency/24 Hours, by Visit: Study 2,' comparing placebo and Trospium chloride groups over 12 weeks. The y-axis displays mean change with standard error, and the x-axis shows weeks of treatment (1, 4, 12). Trospium chloride shows a greater reduction in urinary frequency compared to placebo, with p-values indicated at weeks 1, 4, and 12.*
FDA Label Image

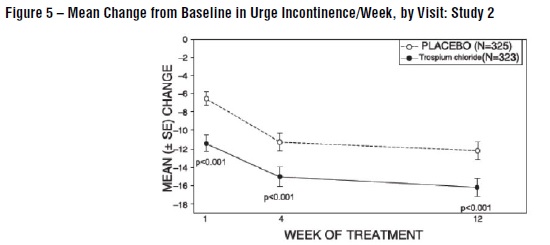
Fig 5 (Draft Labeling 4)

Fig 5 (Draft Labeling 4)
A line graph titled 'Mean Change from Baseline in Urge Incontinence per Week, by Visit: Study 2' showing comparative data between placebo and Trospium Chloride groups over 12 weeks of treatment. The y-axis represents mean change with standard error, and the x-axis represents weeks of treatment (1, 4, 12). Trospium Chloride shows a greater decrease in urge incontinence episodes compared to placebo, with statistical significance noted at weeks 4 and 12.*
FDA Label Image

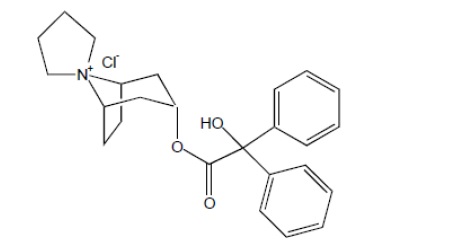
Structure (Draft Labeling 6)

Structure (Draft Labeling 6)
Chemical structure of the active ingredient Trospium Chloride, showing its molecular arrangement with marked rings and functional groups characteristic of this compound.*
FDA Label Image

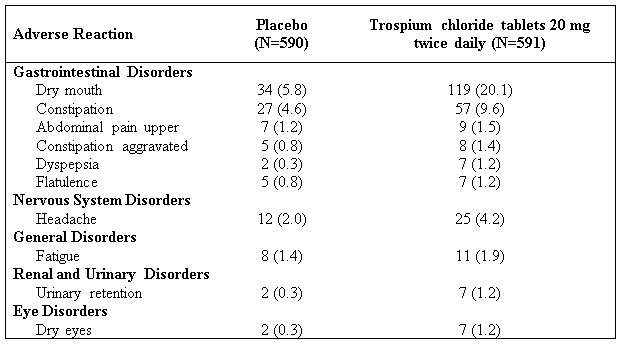
Table 1 (Draft Labeling 7)

Table 1 (Draft Labeling 7)
A data table comparing adverse reactions between placebo and trospium chloride tablets 20 mg taken twice daily. It lists incidence rates of gastrointestinal disorders, nervous system disorders, general disorders, renal and urinary disorders, and eye disorders with specific events such as dry mouth, constipation, headache, fatigue, urinary retention, and dry eyes, showing higher occurrence in the trospium chloride group.*
FDA Label Image

Table 2 (Draft Labeling 8)

Table 2 (Draft Labeling 8)
A data table presenting mean pharmacokinetic parameter estimates with standard deviations for a single 20 mg dose of Trospium Chloride tablets in healthy volunteers. Parameters shown include Cmax (ng/mL), AUC0-∞ (ng/mL·hr), Tmax (hr), and half-life (t½, hr).*
FDA Label Image

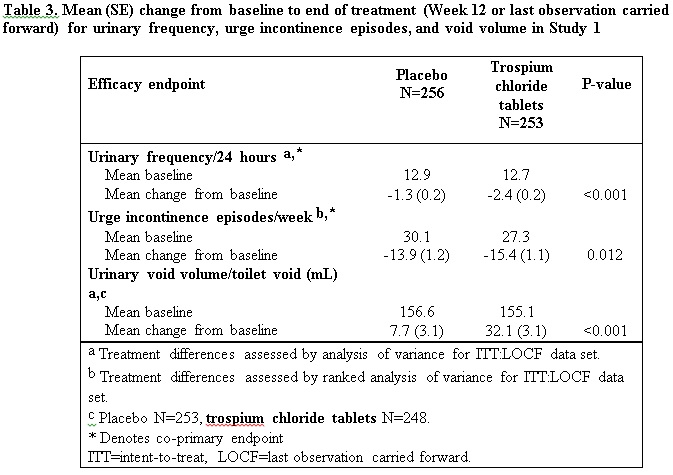
Table 3 (Draft Labeling 9)

Table 3 (Draft Labeling 9)
A data table showing mean changes from baseline to end of treatment (Week 12 or last observation) for urinary frequency, urge incontinence episodes, and urinary void volume in a clinical study comparing placebo and Trospium chloride tablets. The table includes baseline values, mean changes with standard errors, and p-values assessing statistical significance between groups.*
FDA Label Image

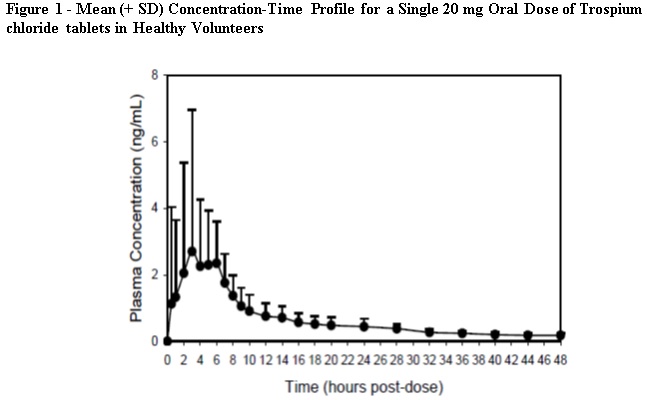
Fig 1 (Draft Labeling)

Fig 1 (Draft Labeling)
A line graph showing the mean plasma concentration-time profile with standard deviation bars for a single 20 mg oral dose of Trospium Chloride tablets in healthy volunteers. The x-axis represents time in hours post-dose up to 48 hours, and the y-axis shows plasma concentration in ng/mL, illustrating the drug concentration's rise and gradual decline over time.*

* About these descriptions: Image descriptions on this page are generated by automated AI analysis of the product label images from the manufacturer's FDA label submission (SPL). They are provided for reference only and may contain errors or omissions. Always rely on the printed label itself and the official FDA labeling, and consult a pharmacist or healthcare professional with any questions about this product.