Ilaris Injection, Solution
Product Images NDC 0078-0734

4 FDA label images from Novartis Pharmaceuticals Corporation · Packaging, Regulatory Labels, and Product Appearance

Product Visual Gallery

This gallery contains 4 technical images submitted to the FDA as part of the official labeling for Ilaris (NDC 0078-0734). Unlike standard consumer photos, these assets often include clinical data figures, molecular chemical structures, and official manufacturer packaging layouts.

As provided by Novartis Pharmaceuticals Corporation, these visuals offer a comprehensive scientific overview of the product's physical and chemical identity, aiding pharmacists and researchers in product verification and study.

FDA Label Image

Figure 1. Mean C-reactive Protein Levels At The End Of Parts 1, 2, And 3 Of Caps Study 1 (Ilaris 01)
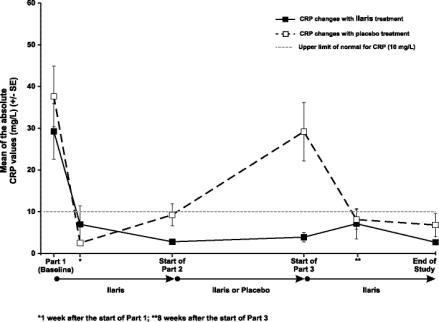
Figure 1. Mean C-reactive Protein Levels At The End Of Parts 1, 2, And 3 Of Caps Study 1 (Ilaris 01)
A line graph depicting mean absolute CRP values (mg/L ± SE) over different study phases for Ilaris (canakinumab) treatment compared to placebo. The x-axis marks study periods including baseline, parts 1 to 3, and end of study. The y-axis shows CRP levels up to 60 mg/L. Solid and dashed lines differentiate CRP changes with Ilaris and placebo treatments, respectively, with a dotted line for the upper normal CRP limit (10 mg/L).*
FDA Label Image

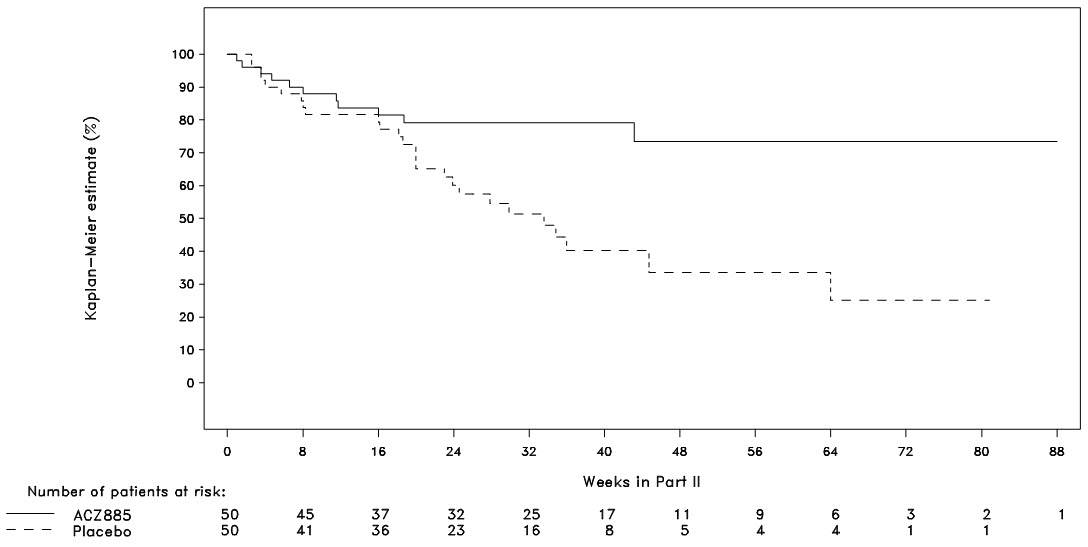
Figure 2. Kaplan-meier Estimates Of The Probability To Stay Flare-free In Part Ii Of Sjia Study 2 By Treatment (ilaris (acz885) And Placebo Groups) (Ilaris 03)

Figure 2. Kaplan-meier Estimates Of The Probability To Stay Flare-free In Part Ii Of Sjia Study 2 By Treatment (ilaris (acz885) And Placebo Groups) (Ilaris 03)
A Kaplan-Meier survival estimate chart comparing two groups: ACZ885 and Placebo. The x-axis shows weeks in Part II up to 88 weeks, while the y-axis shows the Kaplan-Meier estimate percentage from 0% to 100%. The graph includes patient numbers at risk at various time points for both groups. The solid line represents ACZ885, and the dashed line represents Placebo.*
FDA Label Image

Figure 3. Pain Intensity Over Time In The Subpopulation Of Patients Unable To Use Nsaids And Colchicine (study 3, Ilaris (acz885) 150mg) (Ilaris 04)

Figure 3. Pain Intensity Over Time In The Subpopulation Of Patients Unable To Use Nsaids And Colchicine (study 3, Ilaris (acz885) 150mg) (Ilaris 04)
A line chart depicting LS mean ± standard error over time post-dose in hours. It compares three conditions: ACZ885 150 mg (PFS), ACZ885 150 mg (LYO), and Triam 40 mg. The y-axis shows LS mean ± SE, ranging from 0 to 100, and the x-axis shows time points from 6 to 168 hours post-dose. The data lines show a downward trend over time for all three groups.*
FDA Label Image

Principal Display Panel Ndc 0078-0734-61 Ilaris® (canakinumab) Injection 150 mg/ml For Subcutaneous Use Single-dose Vial. Discard Unused Portion Attention: Dispense With Enclosed Medication Guide. Novartis (Ilaris 02)

Principal Display Panel 							Ndc 0078-0734-61 							Ilaris® 							(canakinumab) 							Injection 							150 mg/ml							For Subcutaneous Use						    Single-dose Vial. Discard Unused Portion							Attention: Dispense With Enclosed Medication Guide.							Novartis (Ilaris 02)
Packaging label for Ilaris (canakinumab) injection, 150 mg/mL, for subcutaneous use. The label indicates a single-dose vial with instructions to discard unused portions. It is manufactured by Novartis Pharmaceuticals Corporation. The label includes storage instructions, ingredient list, and a barcode with NDC 0078-0734-61.*

* About these descriptions: Image descriptions on this page are generated by automated AI analysis of the product label images from the manufacturer's FDA label submission (SPL). They are provided for reference only and may contain errors or omissions. Always rely on the printed label itself and the official FDA labeling, and consult a pharmacist or healthcare professional with any questions about this product.