Apidra Solostar Injection, Solution
Product Images NDC 0088-2502

View Photos of Packaging, Regulatory Labels, and Product Appearance

Product Visual Gallery

This gallery contains 27 technical images submitted to the FDA as part of the official labeling for Apidra Solostar (NDC 0088-2502). Unlike standard consumer photos, these assets often include clinical data figures, molecular chemical structures, and official manufacturer packaging layouts.

As provided by Sanofi-aventis U.s. Llc, these visuals offer a comprehensive scientific overview of the product's physical and chemical identity, aiding pharmacists and researchers in product verification and study.

FDA Label Image

Chemical Structure (Apidra 01)

Chemical Structure (Apidra 01)
Chemical structure diagram showing the amino acid sequence of the A-chain and B-chain of insulin glulisine. The diagram highlights peptide bonds and disulfide bridges connecting cysteine residues within and between the chains.*
FDA Label Image

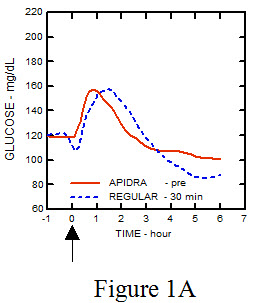
Figure 1a (Apidra 02)

Figure 1a (Apidra 02)
A line graph comparing blood glucose levels over time between Apidra and Regular insulin. The x-axis represents time in hours from -1 to 7, and the y-axis shows glucose levels in mg/dL from 60 to 220. The red solid line depicts Apidra, and the dashed blue line represents Regular insulin, with glucose levels peaking around the 1-hour mark then gradually declining.*
FDA Label Image

Figure 1b (Apidra 03)

Figure 1b (Apidra 03)
A line graph comparing blood glucose levels (mg/dL) over time (hours) for Apidra and regular insulin. The graph shows two lines, one solid red for Apidra and one dashed blue for regular insulin, plotting glucose levels from -1 to 7 hours post-administration.*
FDA Label Image

Figure 1c (Apidra 04)

Figure 1c (Apidra 04)
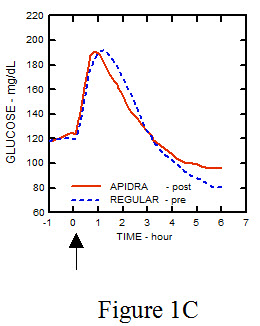
A line graph comparing glucose levels (mg/dL) over time (hours) after administration of Apidra (insulin glulisine) and regular insulin. The graph shows glucose concentrations peaking shortly after injection and declining over approximately 6 hours, with Apidra represented by a solid red line and regular insulin by a dashed blue line.*
FDA Label Image

Image (Apidra 05)

Image (Apidra 05)
An instructional diagram showing an upward arrow labeled as indicating the start of a 15-minute meal, used to guide timing for medication administration or meal intake.*
FDA Label Image

Figure 2 (Apidra 06)

Figure 2 (Apidra 06)
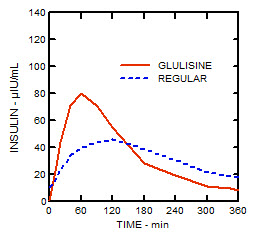
A pharmacokinetic curve comparing insulin concentration (in HU/mL) over time (in minutes) between insulin glulisine and regular insulin. The graph shows insulin concentration on the vertical axis and time on the horizontal axis, illustrating the faster onset and peak of insulin glulisine compared to regular insulin.*
FDA Label Image

Figure 3 (Apidra 07)

Figure 3 (Apidra 07)
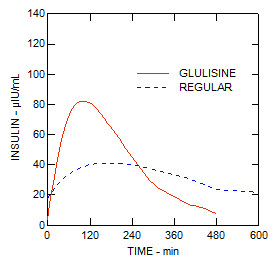
A pharmacokinetic graph comparing insulin concentration (μU/mL) over time (minutes) for Glulisine and Regular insulin. The red solid line represents Glulisine, showing a higher and earlier peak, while the blue dashed line represents Regular insulin with a lower, delayed peak.*
FDA Label Image

Figure 4 (Apidra 08)

Figure 4 (Apidra 08)
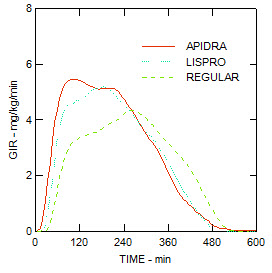
A line graph comparing glucose infusion rates (GIR, in mg/kg/min) over time (minutes) for Apidra, Lispro, and Regular insulin. The graph shows three curves illustrating differences in onset and duration of action for these insulins up to 600 minutes.*
FDA Label Image

Figure (Apidra 09)

Figure (Apidra 09)
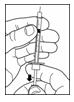
An instructional black-and-white line drawing showing hands holding a vial and preparing an injection, likely illustrating how to use the Apidra SoloStar injection pen or prepare the insulin glulisine solution for subcutaneous administration.*
FDA Label Image

Figure (Apidra 10)

Figure (Apidra 10)
Illustration showing a person using a cap remover tool to remove the protective cap from a vial or similar container, demonstrating part of the preparation process for injection.*
FDA Label Image

Figure (Apidra 11)

Figure (Apidra 11)
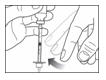
An instructional illustration showing a hand holding a syringe, preparing to withdraw medication from a vial. The image demonstrates proper technique for subcutaneous injection preparation.*
FDA Label Image

Figure (Apidra 12)

Figure (Apidra 12)
An instructional illustration showing hands preparing an injection with a syringe and vial. The image depicts withdrawing liquid from a vial into a syringe, likely for subcutaneous administration.*
FDA Label Image

Figure (Apidra 13)

Figure (Apidra 13)
An instructional illustration showing a hand holding an insulin pen and inserting a needle cap. The image appears to demonstrate part of the preparation process for an injection, likely relevant to the Apidra SoloStar insulin glulisine injection pen.*
FDA Label Image

Figure (Apidra 14)

Figure (Apidra 14)
An instructional illustration showing a hand holding a syringe with a needle attached, and another hand gripping a vial or cartridge cap. The image suggests a step in preparing an injectable solution, such as priming or removing air before injection.*
FDA Label Image

Figure (Apidra 15)

Figure (Apidra 15)
An instructional illustration showing a person preparing a subcutaneous injection in the abdominal area, commonly associated with the use of insulin injection products like Apidra SoloStar.*
FDA Label Image

Figure (Apidra 16)

Figure (Apidra 16)
Illustration showing the correct technique for handling a syringe or injection device with one hand, including thumb and finger positioning. The image likely relates to administration instructions for Apidra SoloStar insulin glulisine injection.*
FDA Label Image

Figure (Apidra 17)

Figure (Apidra 17)
Illustration of the Apidra SoloStar insulin glulisine injection pen components, including the pen cap, pen needle with protective seal (not included), and pen body showing the insulin reservoir, rubber seal, dose window, dosage selector, and injection button. Labels identify each part clearly for instructional use.*
FDA Label Image

Figure (Apidra 18)

Figure (Apidra 18)
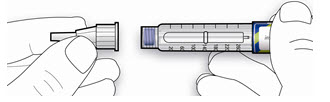
An instructional illustration depicting a hand removing the cap from a prefilled Apidra SoloStar insulin glulisine injection pen. The pen is shown with visible dose markings and a grip area, indicating preparation for subcutaneous injection.*
FDA Label Image

Figure (Apidra 19)

Figure (Apidra 19)
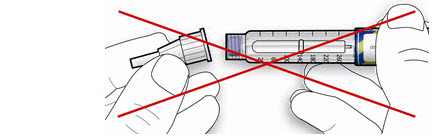
An instructional illustration showing a hands-on demonstration of how to remove the cap from a prefilled Apidra SoloStar injection pen containing insulin glulisine 100 iU/mL solution for subcutaneous use. A red "X" overlay indicates that the action depicted is incorrect or not recommended.*
FDA Label Image

Figure (Apidra 20)

Figure (Apidra 20)
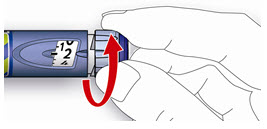
Illustration showing hands holding an Apidra SoloStar insulin glulisine injection pen at 100 units/mL strength, demonstrating the action of lifting or twisting a part of the pen (possibly to prepare the injection). The pen is blue with a dosage window visible.*
FDA Label Image

Figure (Apidra 21)

Figure (Apidra 21)
Instructional diagram showing the proper handling of injection needle components for Apidra SoloStar insulin glulisine injection. It indicates the needle cap to keep and the inner needle cover to discard before use, along with a partial view of the insulin pen with a needle attached.*
FDA Label Image

Figure (Apidra 22)

Figure (Apidra 22)
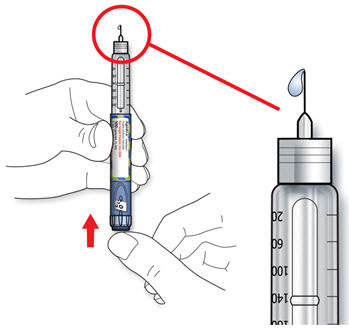
An instructional illustration showing hands holding an Apidra SoloStar insulin glulisine injection pen. The image highlights pushing the injection dose button and the needle tip with a drop of liquid at the end, indicating the preparation or priming of the injection pen before subcutaneous administration.*
FDA Label Image

Figure (Apidra 23)

Figure (Apidra 23)
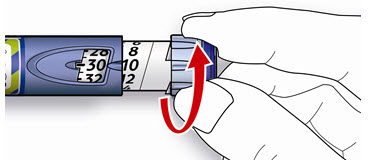
An instructional illustration showing a hand adjusting the dose selector on an Apidra SoloStar insulin glulisine injection pen. The image depicts the twisting of the dose knob marked with dosage numbers indicating the amount of insulin to be injected subcutaneously.*
FDA Label Image

Figure (Apidra 24)

Figure (Apidra 24)
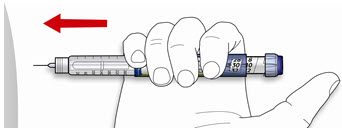
An instructional illustration showing a hand holding an insulin glulisine injection pen, identified as Apidra SoloStar, with a red arrow pointing to the left, indicating the direction for injection or device operation.*
FDA Label Image

Figure (Apidra 25)

Figure (Apidra 25)
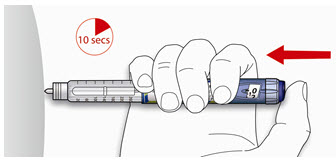
An instructional illustration showing a hand holding an Apidra SoloStar insulin glulisine injection pen. The image depicts a subcutaneous injection being administered, highlighting a 10-second wait time after injection before withdrawing the pen, indicated by an arrow and a timer icon.*
FDA Label Image

Principal Display Panel (10 mL Vial Carton)

Principal Display Panel (10 mL Vial Carton)
Label for Apidra injection, solution, 100 units/mL (U-100) insulin glulisine by sanofi-aventis U.S. LLC. The label shows a blue and yellow striped design with the product name, strength, and dosage form. It states the product is for subcutaneous injection only and includes usage instructions to use only if solution is clear and colorless. The package contains one 10 mL multiple-dose vial and includes storage and handling information.*
FDA Label Image

Principal Display Panel (3 mL Pen Carton)

Principal Display Panel (3 mL Pen Carton)
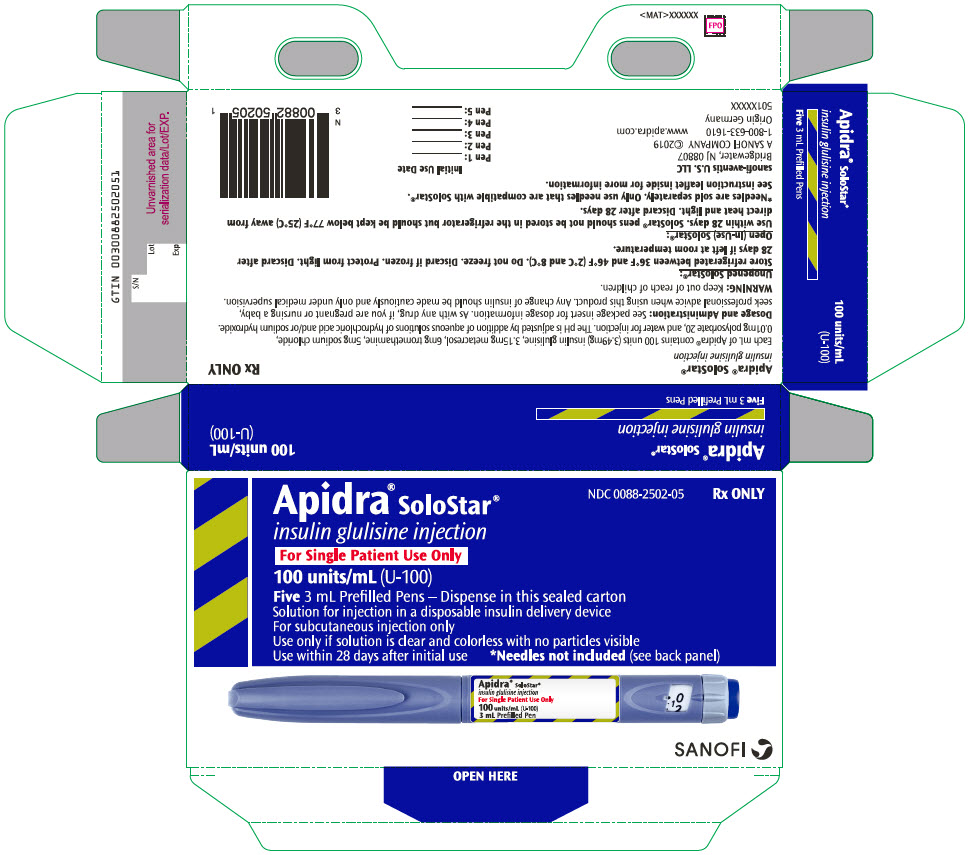
Apidra SoloStar insulin glulisine injection 100 units/mL (U-100) solution packaging label. The label indicates it contains five 3 mL prefilled pens for subcutaneous injection only. The product is for single patient use and does not include needles. The labeler is sanofi-aventis U.S. LLC.*

* About these descriptions: Image descriptions on this page are generated by automated AI analysis of the product label images from the manufacturer's FDA label submission (SPL). They are provided for reference only and may contain errors or omissions. Always rely on the printed label itself and the official FDA labeling, and consult a pharmacist or healthcare professional with any questions about this product.